6

I am using R.

I have a polygon v that covers multiple raster cells in raster z.

How could I calculate what proportion of the polygon is covered by each category in the raster?

I read a solution on Unexpected behaviour of extract function in the raster package which suggested rasterizing the polygon, polygonizing the raster, and then using terra::extract. This may work for the reproducible example here, but I'm looking for a solution that will scale to work with 2500 polygons and a raster with 100,000 rows and 100,000 columns.

I have assumed that the above solution would not work well with such a large dataset.

library(terra)

f <- system.file("ex/lux.shp", package="terra")
v <- vect(f)
v <- v[1,]
z <- rast(v, resolution=.09, names="test")
values(z) <- 1:ncell(z)
levels(z) <- 0:ncell(z)

plot(z)
plot(v, add = T)

Map of raster z and polygon v

3
  • 1
    Have you tried the exactextractr package? Its fast and gives you the area of partial grid overlaps. I'm using it on a 60,000x60,000 raster (with two layers) and its not too painful, your pain may vary depending on the complexity of your polygons and the power of your computer (but this is trivially parallelizable over polygons anyway). Doesn't seem to yet work with terra so try raster?
    – Spacedman
    Commented Mar 10, 2022 at 22:02
  • See isciences.gitlab.io/exactextractr/articles/… for some examples. The vignette is written using raster but terra is supported and often much faster.
    – dbaston
    Commented Mar 10, 2022 at 23:36
  • 3
    @dbaston Ah ha. exact_extract doesn't work with the vector polygon classes from terra, it can extract from the raster classes of terra but y has to be an sf or sp class polygonal object. I don't know why terra had to define yet another class of spatial data features but oh well..
    – Spacedman
    Commented Mar 11, 2022 at 9:06

1 Answer 1

3

Thank you for sending me in the right direction with exactextractr, @Spacedman. Here's the solution that I came up with:

library(terra)
library(exactextractr)
library(dplyr)
library(sf)


f <- system.file("ex/lux.shp", package="terra")
v <- st_read(f)
v <- v[1:2,]
z <- rast(vect(v), resolution=.09, names="test")
values(z) <- 1:ncell(z)
levels(z) <- 0:ncell(z)

plot(z)
plot(v, add = T)
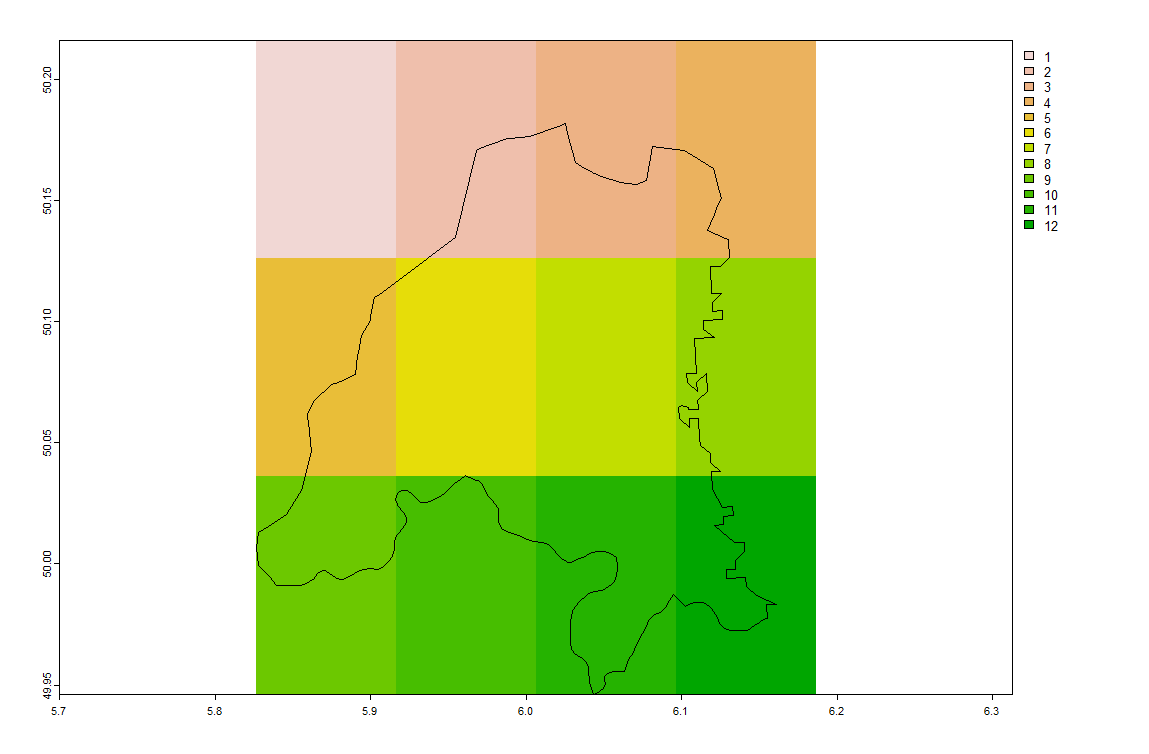
#extract the area of each cell that is contained within each polygon
x <- exact_extract(z, v, coverage_area = TRUE)

#add polygon names that the results will be grouped by
names(x) <- v$NAME_2

#bind the list output into a df and calculate the proportion cover for each category
test <- bind_rows(x, .id = "region") %>%
  group_by(region, value) %>%
  summarize(total_area = sum(coverage_area)) %>%
  group_by(region) %>%
  mutate(proportion = total_area/sum(total_area))

Edit: With a big dataset, I was having memory issues with the code above. Here's a more memory efficient version:


### Summarizing function

sum_cover <- function(x){
  list(x %>%
    group_by(value) %>%
    summarize(total_area = sum(coverage_area)) %>%
    mutate(proportion = total_area/sum(total_area)))
  
}

#extract the area of each raster cell covered by the plot and summarize
x <- exact_extract(z, v, coverage_area = TRUE, summarize_df = TRUE, fun = sum_cover)


#add plot names to the elements of the output list
names(x) <- v$NAME_2

#merge the list elements into a df
test <- bind_rows(x, .id = "Plot_buffer")


2
  • st_read is from sf package. Please remember to load it.
    – ay__ya
    Commented Aug 31, 2022 at 17:35
  • Edited accordingly Commented Sep 1, 2022 at 18:57

Your Answer

By clicking “Post Your Answer”, you agree to our terms of service and acknowledge you have read our privacy policy.

Not the answer you're looking for? Browse other questions tagged or ask your own question.