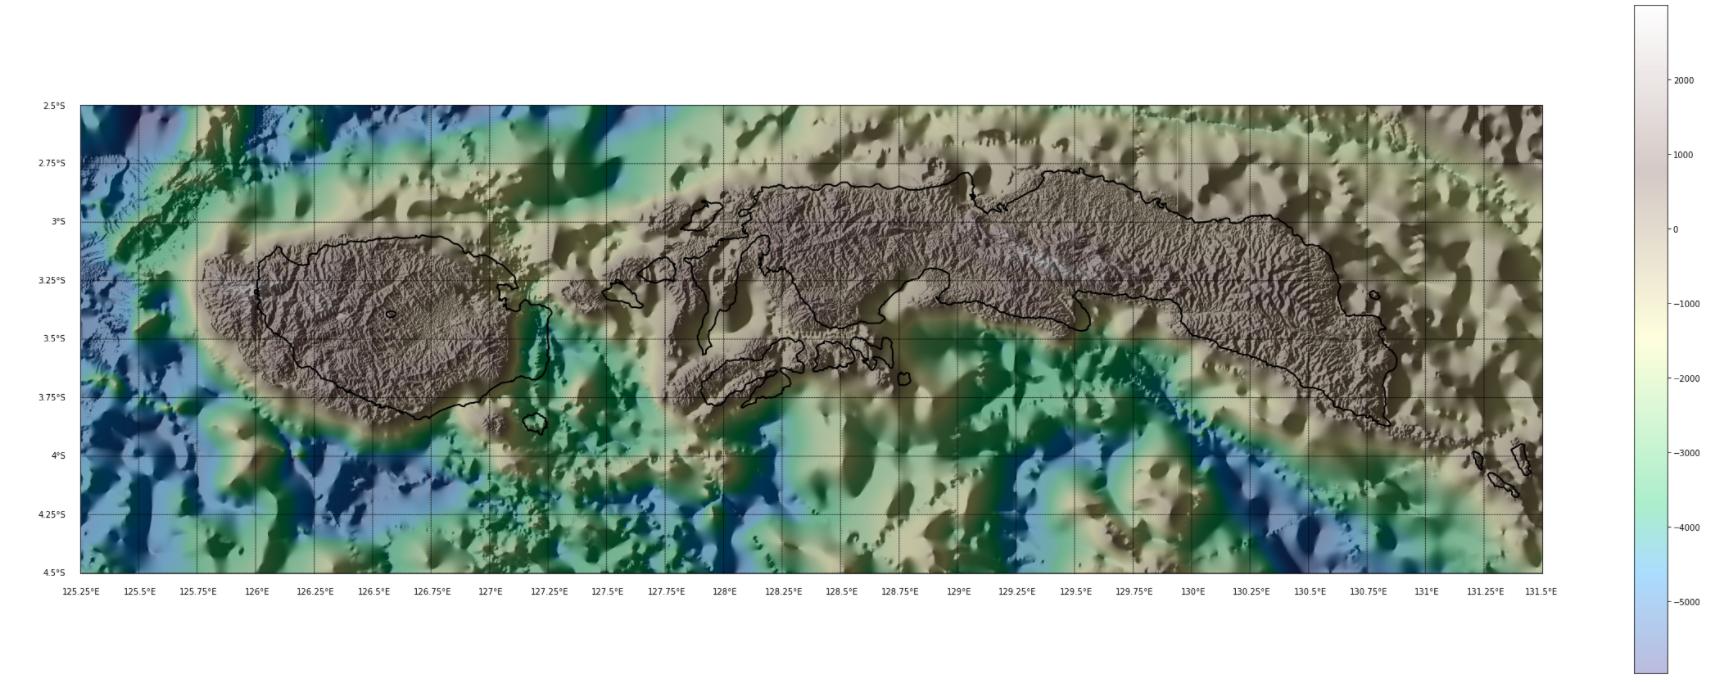
I try to plot hillshade image processed with GDAL with matplotib basemap coastline, but the resulting projection did not match. Here are my code:
from mpl_toolkits.basemap import Basemap
import matplotlib.pyplot as plt
from osgeo import gdal

bounds = [125.25, 131.5, -4.5, -2.5]
dem = gdal.Open('raster.tif')
hillshade = gdal.DEMProcessing('hillshade.tif', dem, 'hillshade',
                               computeEdges = True,
                              multiDirectional = True, zFactor=2)
hillshadeArray = hillshade.GetRasterBand(1).ReadAsArray()
elevArray = dem.GetRasterBand(1).ReadAsArray()

plt.figure(figsize=(40,15))
m = Basemap(epsg = '4326',
            resolution = 'h',
            llcrnrlon = bounds[0],
            llcrnrlat = bounds[2],
            urcrnrlon = bounds[1],
            urcrnrlat = bounds[3])
m.imshow(hillshadeArray, cmap='gray', origin='upper')
m.imshow(elev, cmap='terrain', alpha=0.33, origin='upper')
m.drawcoastlines(color='black', linewidth=2)
m.drawmeridians(np.arange(125, 132, 0.25), labels=[0,0,0,1])
m.drawparallels(np.arange(-5, -2, 0.25), labels=[1,0,0,0])
plt.colorbar()
plt.show()
What is the issue here and how to fix it?

