Question
I have a dataset in Python that tracks the flightpath of an object. I know the minimum and maximum latitude and longitude of the flightpath. The flightpath is entirely over the Montana.
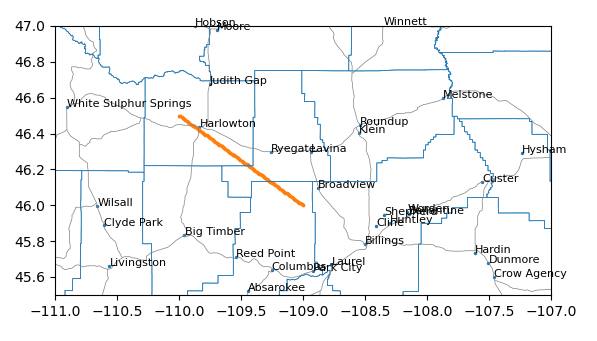
Is there a way to plot the flight path coordinates over the relevant portion of a map of the US?
Example code and desired output
For simplicity, suppose that my flightpath is a "straight" line that starts at lat_start=46, lon_start=-109 and ends at lat_end=46.5,lon_end=-110. The duration of the flight is 1 hour and the object has constant upward velocity of 1 m/s during the flight.
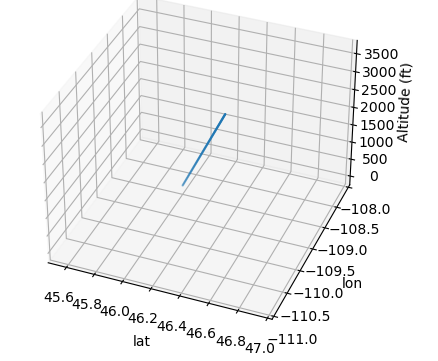
It would be really cool to have a 3D scatterplot showing the flight path in 3D space with the map shown on the bottom surface of the scatterplot, beneath the lat-lon-altitude points.
But a 2D scatterplot with just the lat-lon coordinates shown on top of a map would also be great.
import matplotlib.pyplot as plt
import numpy as np

# starting, ending latitudes and longitudes
lat_start=46
lat_end=46.5
lon_start=-109
lon_end=-110

upward_vel=1 #m/s
flight_time=3600 #s

# example flight path data
lat=np.linspace(lat_start,lat_end,100)
lon=np.linspace(lon_start,lon_end,100)
alt=np.linspace(0,upward_vel*flight_time,100)

# 3d scatterplot showing flight path
# how to show map on bottom plane of plot?
fig=plt.figure()
ax=fig.add_subplot(projection='3d')
ax.scatter(lat,lon,alt,marker='.',s=2)
ax.set_xlabel('lat')
ax.set_ylabel('lon')
ax.set_zlabel('Altitude (m/s)')
plt.xlim(45.5,47)
plt.ylim(-111,-108)
plt.show()
Here is the output from the example code above. I would like to display the map on the bottom surface of the 3D plot, or if that's no possible, simply overlay my flight data on a 2D plot.


