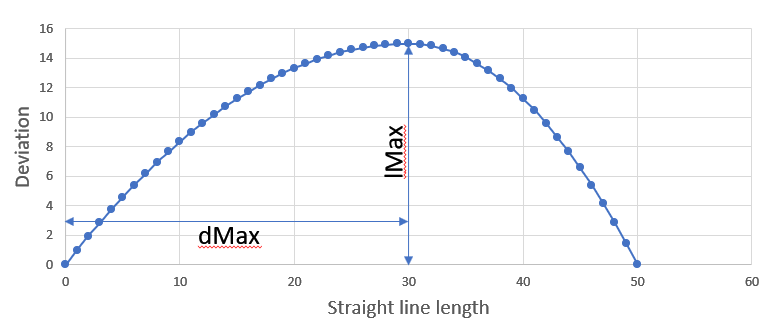
This is nice geometry exercise and requires coding. To create a family of curves we can compute deviation from straight line using 2 randomly selected parameters; use parabola for smooth transition; draw variable length perpendiculars to actual line and connect their end points:

Note that if we pick dMax at mid point of the line (25 in this case), we'll get symmetric 'wings'.
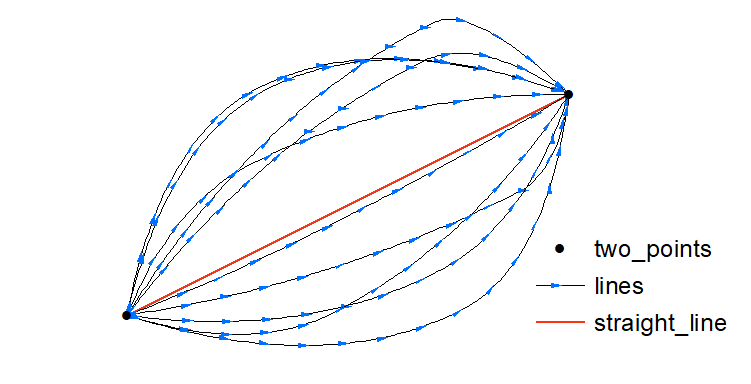
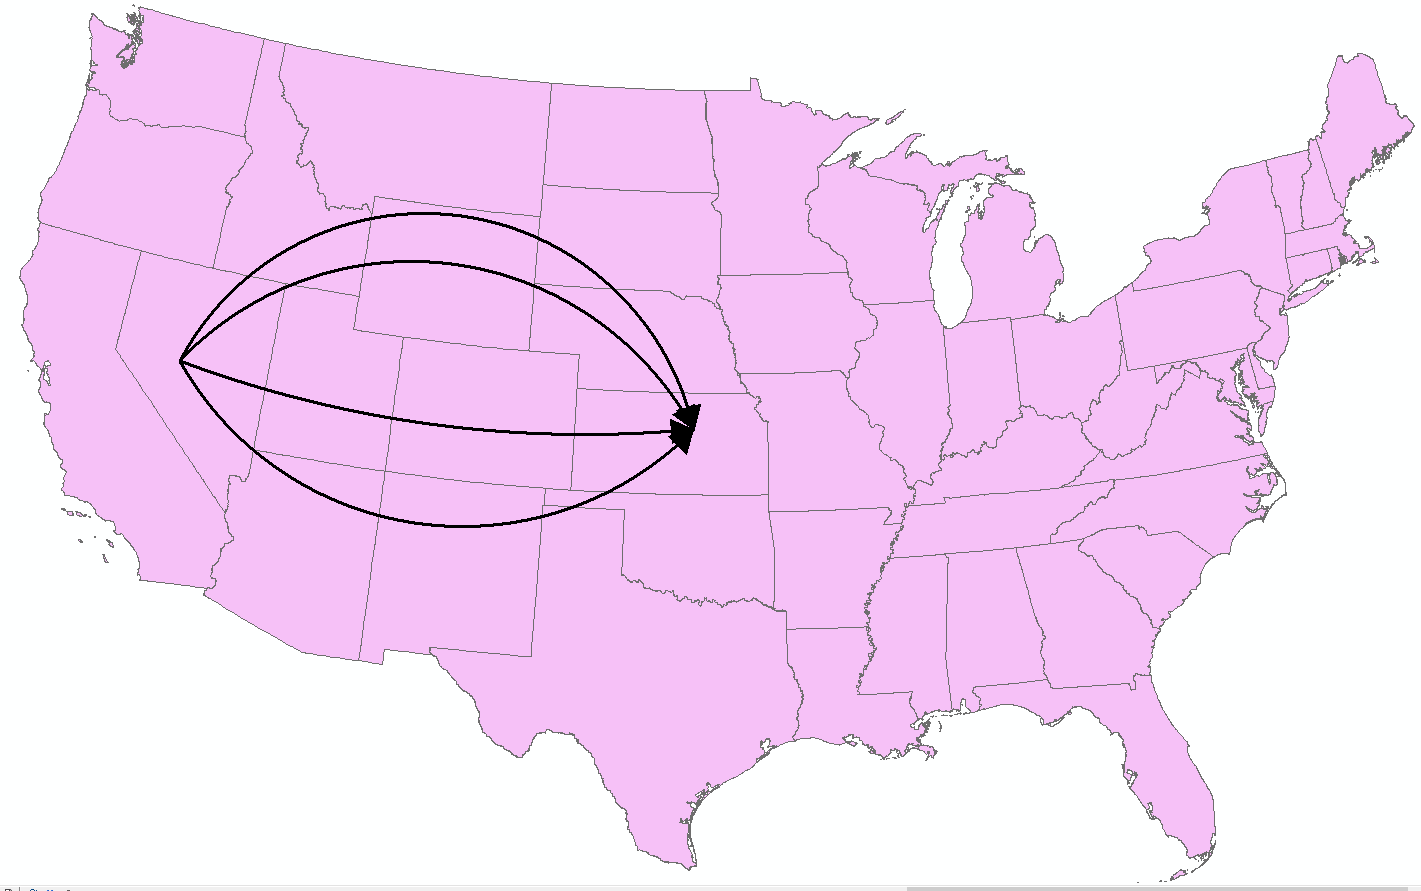
Output for 10 lines might look like this:

import numpy as np
import scipy, random

def RotateExtend(j):
    iDmax = random.randint(10, 90)
    dMax = dAlong[iDmax]            # max deviation location (dMax)
    iLmax = random.randint(0, 30)
    lMax = dAlong[iLmax]            # max deviation itself
    leftA = -lMax/dMax/dMax         # parabola coef left from dMax
    rightA = -lMax/(lenV-dMax)**2   # parabola coef right from dMax
##  length of perpendicular
    sLength =np.array([lMax+(x-dMax)**2*[leftA,rightA][x>=dMax] for x in dAlong])
    i = j%2                         # left or right side of straight line
##  perpendicular end points
    sX = -dY*sLength/lenV
    sY = dX*sLength/lenV
    if i: sX+=DF_X;sY+=DF_Y
    else: sX = DF_X-sX;sY = DF_Y - sY
    points = arcpy.Array([arcpy.Point(x,y) for x,y in zip(sX,sY)])
    pLine = arcpy.Polyline(points)
    return pLine

infc = "two_points"
array = arcpy.da.FeatureClassToNumPyArray(infc, ["SHAPE@X","SHAPE@Y"])
XS,XE = array["SHAPE@X"]; dX = XE-XS
YS,YE = array["SHAPE@Y"]; dY = YE-YS
DF_X = np.linspace(XS,XE,100)
DF_Y = np.linspace(YS,YE,100)
dAlong = np.array([x[0] for x in scipy.spatial.distance.cdist(zip(DF_X,DF_Y),[[XS,YS]])])
lenV = dAlong[-1]
lines = map(RotateExtend,range(10))
outfc = arcpy.GetParameterAsText(0)
arcpy.management.CopyFeatures(lines,outfc)
If you need more than 10 polylines change this line of code accordingly:
lines = map(RotateExtend,range(**10**))


