0

I extracted daytime and nighttime land surface temperatures (LST) of my 13 points from the Modis MOD11A1 dataset using Google Earth Engine (GGE). For this task I modified the following code:

var Bhagirathi = ee.FeatureCollection("users/Vineeth_Russell/NRSC_Bhagirathi_shp");

//Terra and Aqua Day time LST Daily Global 1km
var day_terra = ee.ImageCollection("MODIS/006/MOD11A1")
                  .filter(ee.Filter.date('2000-03-05', '2010-01-01'))
                  .select('LST_Day_1km','QC_Day');


//Terra and Aqua Night time LST Daily Global 1km
var night_terra = ee.ImageCollection("MODIS/006/MOD11A1")
                    .filter(ee.Filter.date('2000-03-05', '2010-01-01'))
                    .select('LST_Night_1km','QC_Night');


//create mask to extract only highest quality day band data 
var filterDay = function(image){ 
  var qa = image.select('QC_Day');
  var bitMask2 = 1 << 2;
  var mask = qa.bitwiseAnd(bitMask2).eq(0);
  return image.updateMask(mask);
};


//create mask to extract only highest quality night band data 
var filterNight = function(image){ 
  var qa = image.select('QC_Night');
  var bitMask2 = 1 << 2;
  var mask = qa.bitwiseAnd(bitMask2).eq(0);
  return image.updateMask(mask);
};


//apply mask to image collection
var lst_d_terra = day_terra.map(filterDay);
var lst_n_terra = night_terra.map(filterNight);


//Scale to Kelvin and convert to Celsius, set image acquisition time (Terra Day-time)
lst_d_terra = lst_d_terra.map(function(img) {
  return img.select('LST_Day_1km')
    .multiply(0.02)
    .subtract(273.15)
    .copyProperties(img, ['system:time_start','system:time_end']);
});


//Scale to Kelvin and convert to Celsius, set image acquisition time (Terra Night-time)
lst_n_terra = lst_n_terra.map(function(img) {
  return img.select('LST_Night_1km')
    .multiply(0.02)
    .subtract(273.15)
    .copyProperties(img, ['system:time_start','system:time_end']);
});


//Charting Terra Day-time LST over Bhagirathi
print(Chart.image.series(lst_d_terra, Bhagirathi,ee.Reducer.mean(),1000).setOptions({
   title: "Time Series of MODIS Terra Daily Day-time LST across Bhagirathi",
   hAxis: {
     title: "Time Period",
     titleTextStyle: {italic: false, bold: true}
   },
   vAxis: {
     title: "LST",
     titleTextStyle: {italic: false, bold: true}
   },
   colors: ["Red"]
}));


//Charting Terra Night-time LST over Bhagirathi
print(Chart.image.series(lst_n_terra, Bhagirathi,ee.Reducer.mean(),1000).setOptions({
   title: "Time Series of MODIS Terra Daily Night-time LST across Bhagirathi",
   hAxis: {
     title: "Time Period",
     titleTextStyle: {italic: false, bold: true}
   },
   vAxis: {
     title: "LST",
     titleTextStyle: {italic: false, bold: true}
   },
   colors: ["Blue"]
}));

and try to export the daytime values regarding the code stated below.

var yearly = ee.ImageCollection('JRC/GSW1_0/YearlyHistory');
// function to map over the FeatureCollection
var mapfunc = function(feat) {
  // get feature geometry
  var geom = feat.geometry()
  // function to iterate over the yearly ImageCollection
  // the initial object for the iteration is the feature
  var addProp = function(img, f) {
    // cast Feature
    var newf = ee.Feature(f)
    // get date as string
    var date = img.date().format()
    // extract the value (first) of 'waterClass' in the feature
    var value = img.reduceRegion(ee.Reducer.first(), geom, 30).get('waterClass')
    // if the value is not null, set the values as a property of the feature. The name of the property will be the date
    return ee.Feature(ee.Algorithms.If(value,
                                       newf.set(date, ee.String(value)),
                                       newf.set(date, ee.String('No data'))))
  }
  var newfeat = ee.Feature(yearly.iterate(addProp, feat))
  return newfeat
};

var newft = fg_points.map(mapfunc);

// Export
Export.table.toDrive(newft,
"export_Points",
"export_Points",
"export_Points");

So far this worked well for extracting and exporting LST values.

I also wanted to extract the observation time for day and night LST values. However, I can not manage to extract and export the observation times to my Google drive in CSV format. I haven't used MODIS MOD11A1 data before and I'm pretty novice to Google Earth Engine.

Here is my GRE code.

Edit1:

Actually, in Modis MOD11A1 dataset, there is a band called Day_view_time and Night_view_time. When I copy and pasted the coordinates and modified @xunilk 's code it worked both for LST and observation time values. However, I could not perform it with a table instead of FeatureCollection. How can I export the values to my Google Drive if I import my points as table using assets?

Here is my updated code.

4
  • Your repository users/maggie06/Thesis-Denemeler does not exist. It cannot be accessed.
    – xunilk
    Commented Jul 3, 2022 at 15:24
  • As per the help center please do not include chit chit like statements of appreciation within your posts.
    – PolyGeo
    Commented Jul 4, 2022 at 4:04
  • @xunilk I changed the share repo configuration to anyone can read. Sorry for the inconvenience.
    – Ayda Aktas
    Commented Jul 4, 2022 at 8:18
  • I found out your issue. Please, see my Editing Note with the answer.
    – xunilk
    Commented Jul 5, 2022 at 14:40

1 Answer 1

2

You can not manage for extracting and exporting in CSV format to Google drive the observation times associated to your data, probably, because you are pairing them to features points instead number of values in dates range.

In your considered dates range, there are 3540 values (including no data) for each point. No spreadsheet can handle such a number of columns and this makes it difficult to visualize the data exported as property for each feature. In this case, it is preferable to create a feature collection with 3540 null features where for each one can be set respective date. Afterward, temperatures can also be set for each feature mapping corresponding temperatures list.

I adapted code of your provided links for extracting and exporting day LST temperatures only for 3 arbitrary points in USA. Code looks as follows.

var fg_points = [ee.Geometry.Point([-106.9333984375, 43.79068443078571]),
                 ee.Geometry.Point([-102.4509765625, 45.878305717679915]),
                 ee.Geometry.Point([-100.0779296875, 44.13861774233129])];

var fg_points = ee.FeatureCollection(fg_points);

print(fg_points);
Map.addLayer(fg_points);

//Terra and Aqua Day time LST Daily Global 1km
var day_terra = ee.ImageCollection("MODIS/006/MOD11A1")
                  .filter(ee.Filter.date('2000-03-05', '2010-01-01'))
                  .select('LST_Day_1km','QC_Day');

var allDatesDay = ee.List(day_terra.aggregate_array('system:time_start'));

var allDatesDay = allDatesDay.map(function(date){
  return ee.Date(date).format().slice(0,10);
  });

//Terra and Aqua Night time LST Daily Global 1km
var night_terra = ee.ImageCollection("MODIS/006/MOD11A1")
                    .filter(ee.Filter.date('2000-03-05', '2010-01-01'))
                    .select('LST_Night_1km','QC_Night');

//create mask to extract only highest quality day band data 
var filterDay = function(image){ 
  var qa = image.select('QC_Day');
  var bitMask2 = 1 << 2;
  var mask = qa.bitwiseAnd(bitMask2).eq(0);
  return image.updateMask(mask);
};

//create mask to extract only highest quality night band data 
var filterNight = function(image){ 
  var qa = image.select('QC_Night');
  var bitMask2 = 1 << 2;
  var mask = qa.bitwiseAnd(bitMask2).eq(0);
  return image.updateMask(mask);
};

//apply mask to image collection
var lst_d_terra = day_terra.map(filterDay);
var lst_n_terra = night_terra.map(filterNight);


//Scale to Kelvin and convert to Celsius, set image acquisition time (Terra Day-time)
lst_d_terra = lst_d_terra.map(function(img) {
  return img.select('LST_Day_1km')
    .multiply(0.02)
    .subtract(273.15)
    .copyProperties(img, ['system:time_start','system:time_end']);
});


//Scale to Kelvin and convert to Celsius, set image acquisition time (Terra Night-time)
lst_n_terra = lst_n_terra.map(function(img) {
  return img.select('LST_Night_1km')
    .multiply(0.02)
    .subtract(273.15)
    .copyProperties(img, ['system:time_start','system:time_end']);
});

var points = fg_points.toList(fg_points.size());

print("points", points);

var allTempList = points.map(function (p) {

  var getTemperature = function(image) {
  // Reducing region and getting value
  
    var value = ee.Image(image)
      .reduceRegion(ee.Reducer.first(), ee.Feature(p).geometry())
      .get('LST_Day_1km');

    var temp_list = ee.Algorithms.If(value, value, 'no data'); 

    return temp_list;
  
  };

  var count = lst_d_terra.size();

  var temp_list = lst_d_terra.toList(count).map(getTemperature);

  return temp_list;

});

//print(allTempList);

var myFeatures = ee.FeatureCollection(ee.List(allDatesDay).map(function(el){

    return ee.Feature(null, {
      'date': el,
    });

}));

var temp1 = ee.List(allTempList).get(0);
var temp2 = ee.List(allTempList).get(1);
var temp3 = ee.List(allTempList).get(2);

myFeatures = myFeatures.map(function (ele) {
  
  return ele.set('temp1', ee.List(temp1).get(ee.Number.parse(ele.id())))
            .set('temp2', ee.List(temp2).get(ee.Number.parse(ele.id())))
            .set('temp3', ee.List(temp3).get(ee.Number.parse(ele.id())));
});

//print(myFeatures);

// Export
Export.table.toDrive(myFeatures,
"export_Points",
"GEE_Folder",
"export_Points");

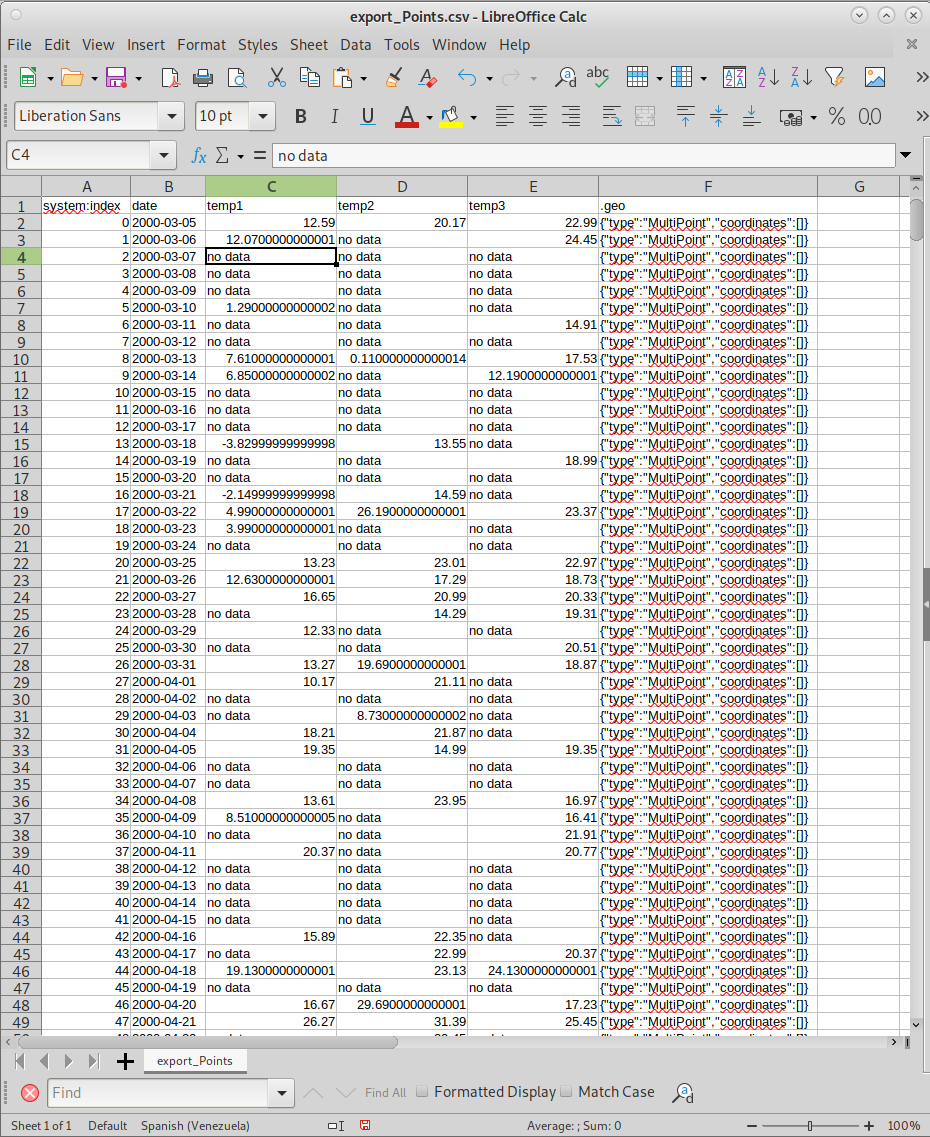
After running it in GEE code editor, part of obtained CSV file (with 3540 records) can be observed in following picture. The temp1, temp2 and temp3 list of values are associated, respectively, to feature 1, 2 and 3. It is also observed image date. You can adapt above code for your corresponding 13 points and Night images.

enter image description here

Editing Note:

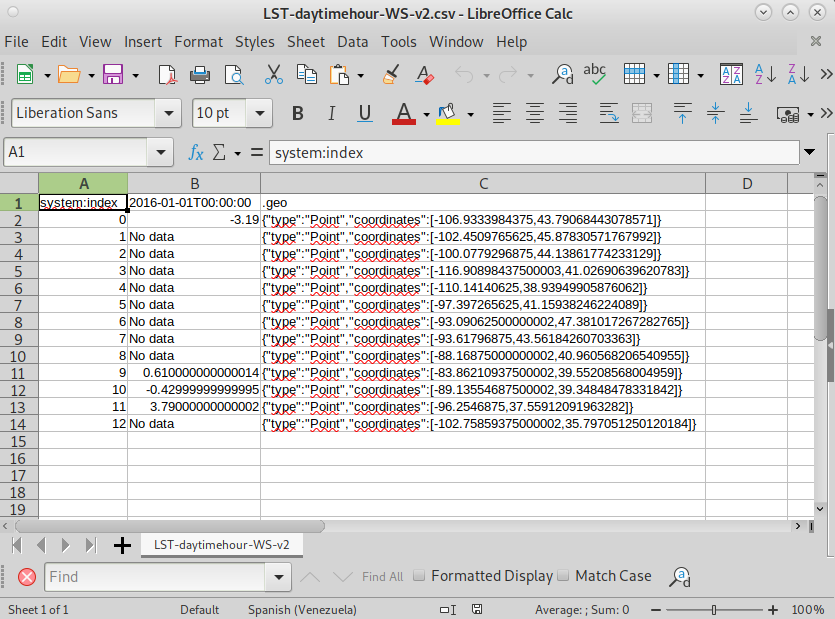
Your code doesn't work because you are using a wrong band: 'day_terra_hour'. It is 'LST_Day_1km' or 'LST_Night_1km'. By using the first one, I could export your CSV file (LST-daytimehour-WS-v2.csv). Your code was run with 13 arbitrary points in USA because your Collection asset 'users/maggie06/WindStations-v1' was not found. However, obtained CSV has not sense; as it can be observed in following picture.

enter image description here

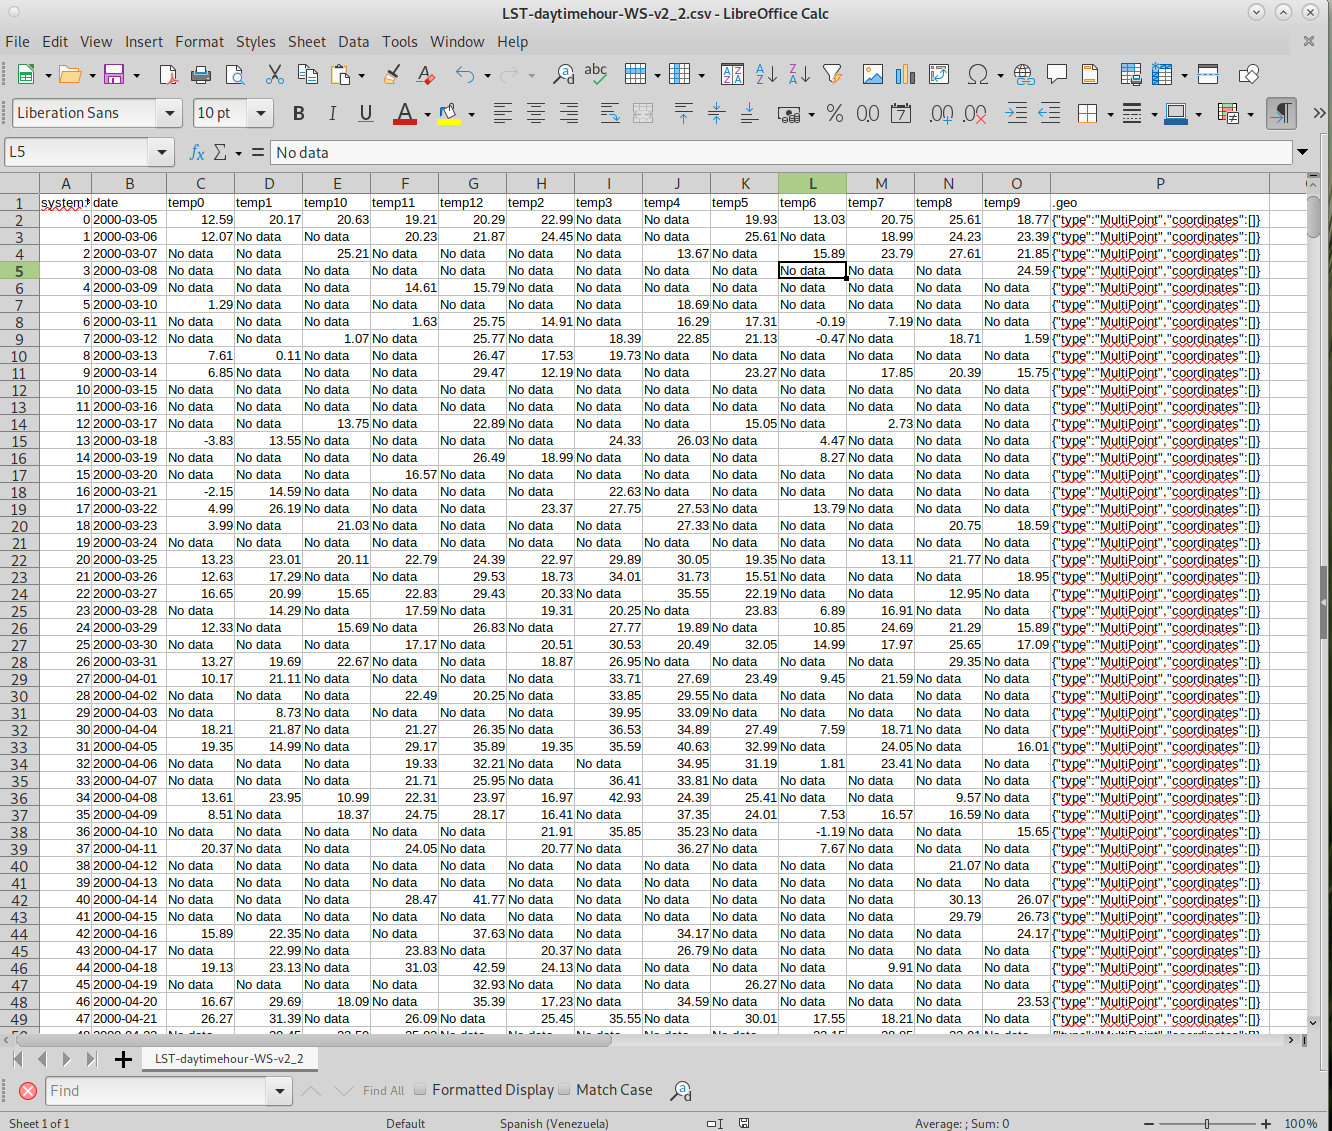
So, I modified your code as in this link and CSV file was obtained as expected (with 3540 records including system:index, date and temperatures for each one of 13 points). It can be observed in following picture.

enter image description here

1
  • I updated my question regarding your answer.
    – Ayda Aktas
    Commented Jul 8, 2022 at 17:46

Your Answer

By clicking “Post Your Answer”, you agree to our terms of service and acknowledge you have read our privacy policy.

Not the answer you're looking for? Browse other questions tagged or ask your own question.