library(raster)

# read in bathymetery raster
[https://drive.google.com/file/d/15kAcfQBJh_JiYgH-YrZZTJeeWOPd0Ysh/view?usp=sharing][1]
r = raster('./ibcso.tif')
plot(r)

# set cells above sea level to NA and others to 1
r[r >= 0] <- NA
r[r < 0] <- 1
plot(r)

# make a SpatialPolygonDataframe
library(stars)
library(sf)
p = as_Spatial(st_as_sf(stars::st_as_stars(r),
                       as_points = F, merge = T))

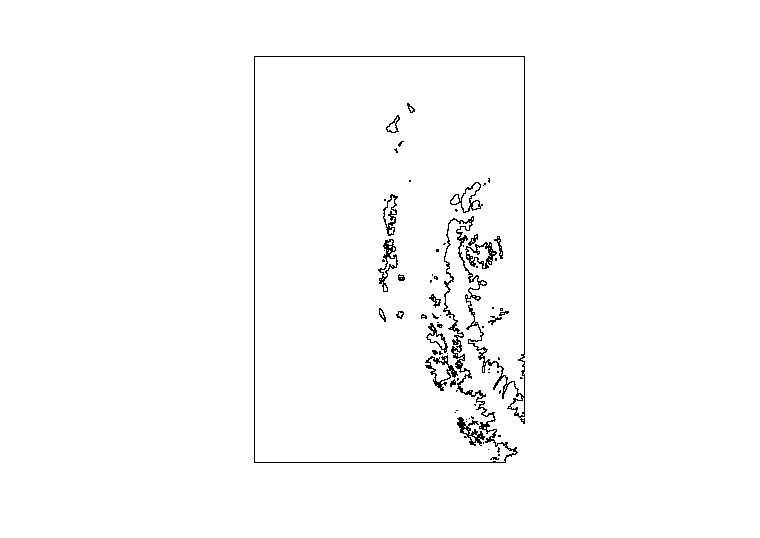
plot(p)
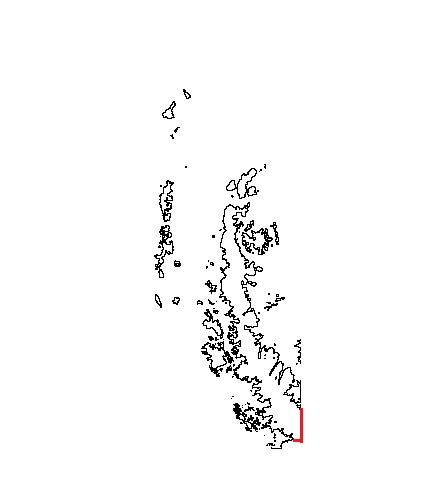
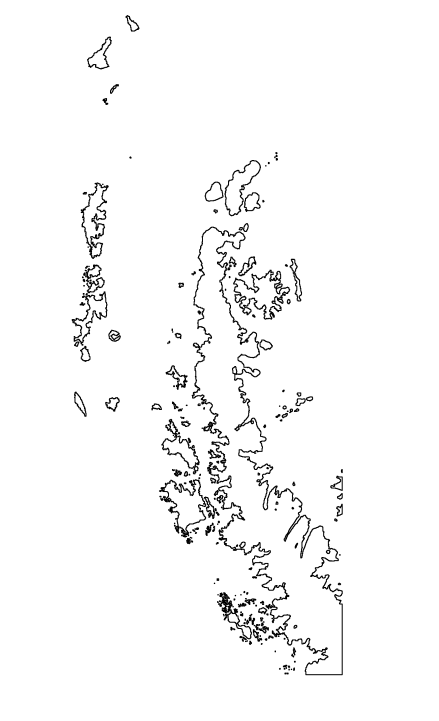
Above, I import a raster of elevation/bathymetry values. Link to raster here. I change the values of the raster to identify the coastline (where raster values == 0) and convert this to a SpatialPolygonsDataFrame. The plot shows the resultant polygons. In the right bottom corner of the figure the polygon is 'open', and thus forms a line along the edge of the original raster.
I would like to exclude this effect, so that the SpatialPolygonsDataFrame plot looks something like this:


