2

I would like to convert coordinates from two different CRS on R.

From To
DATUM ETRS89 BELGIAN DATUM 72
Ellipsoid GRS80 HAYFORD24
Projection None LAMBERT [1972]
Coordinates GEOGRAPHIC PLANE

The original coordinates are in degrees and the output should be in x,y

You will find here a sample of the dataset:

structure(list(name = c("12112", "12201", "12202", "12203", "12208", 
"12209"), lat = c(50.0855877916667, 50.0855997333333, 50.0856167121212, 
50.0856117666667, 50.0856332380952, 50.0855853833333), lon = c(4.55540004166667, 
4.55512903333333, 4.55519089393939, 4.5551871, 4.55524742857143, 
4.55543285), id = c("12112", "12201", "12202", "12203", "12208", 
"12209")), row.names = c(NA, 6L), class = "data.frame")
1
  • I'm not sure there's enough info in the table. "Lambert" could be any of several projections (conical, azimuthal, cylindrical), and they need some parameters to define aspects of the projection (eg the azimuthal point, or how the projection cone is defined). It could be epsg.io/31370 which seems to have all the elements of the table... I'll write an answer based on this but beware it might not be right...
    – Spacedman
    Commented Feb 18, 2023 at 13:46

1 Answer 1

2

https://epsg.io/31370 seems to have the right datum, ellipsoid, and a projection from the Lambert family. It might be the correct projection for your data, but you don't give all the parameters so I can't be 100% but it looks like a standard defined at some time. Let's use it. But beware...

I'll use the sf package to create a spatial data frame, set the coordinate system to what I think is your origin coordinate system (EPSG 4258 https://epsg.io/4258). Again I'm not 100% this is what your input is in, but I'll go with it. Its clearly not the usual "GPS" coordinates which are based on the WGS84 ellipsoid and are EPSG 4326. I'll use 4258:

d is your structure:

> library(sf)
> d = st_as_sf(d, coords=c("lon","lat"), crs="EPSG:4258" )
> d
Simple feature collection with 6 features and 2 fields
Geometry type: POINT
Dimension:     XY
Bounding box:  xmin: 4.555129 ymin: 50.08559 xmax: 4.555433 ymax: 50.08563
Geodetic CRS:  ETRS89
   name    id                  geometry
1 12112 12112   POINT (4.5554 50.08559)
2 12201 12201  POINT (4.555129 50.0856)
3 12202 12202 POINT (4.555191 50.08562)
4 12203 12203 POINT (4.555187 50.08561)
5 12208 12208 POINT (4.555247 50.08563)
6 12209 12209 POINT (4.555433 50.08559)

and now use st_transform to convert to what I think is your output coordinate system:

> dt = st_transform(d, "EPSG:31370")
> dt
Simple feature collection with 6 features and 2 fields
Geometry type: POINT
Dimension:     XY
Bounding box:  xmin: 163339 ymin: 86055.98 xmax: 163360.8 ymax: 86061.27
Projected CRS: Belge 1972 / Belgian Lambert 72
   name    id                  geometry
1 12112 12112 POINT (163358.4 86056.24)
2 12201 12201   POINT (163339 86057.52)
3 12202 12202 POINT (163343.4 86059.42)
4 12203 12203 POINT (163343.2 86058.87)
5 12208 12208 POINT (163347.5 86061.27)
6 12209 12209 POINT (163360.8 86055.98)

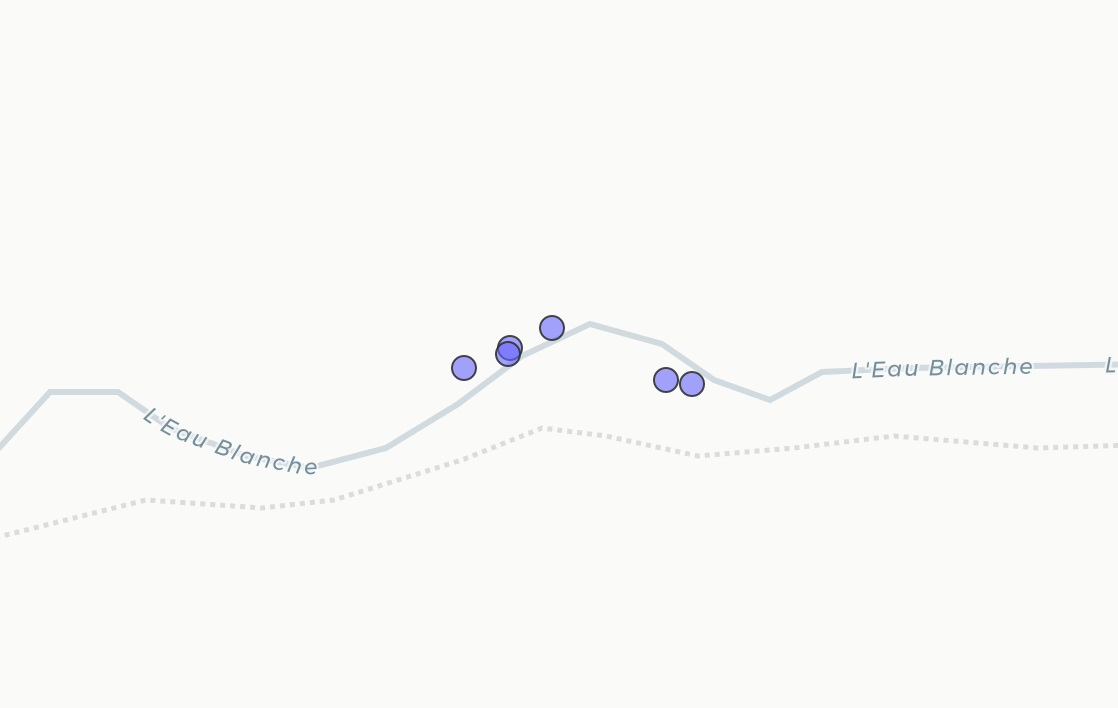
This puts them:

> library(mapview)
> mapview(dt)

enter image description here

on a river in Belgium...

1
  • Works perfectly, thank you ! I didn't know about the website epsg.io, really useful.
    – C. Guff
    Commented Feb 19, 2023 at 10:56

Your Answer

By clicking “Post Your Answer”, you agree to our terms of service and acknowledge you have read our privacy policy.

Not the answer you're looking for? Browse other questions tagged or ask your own question.