1

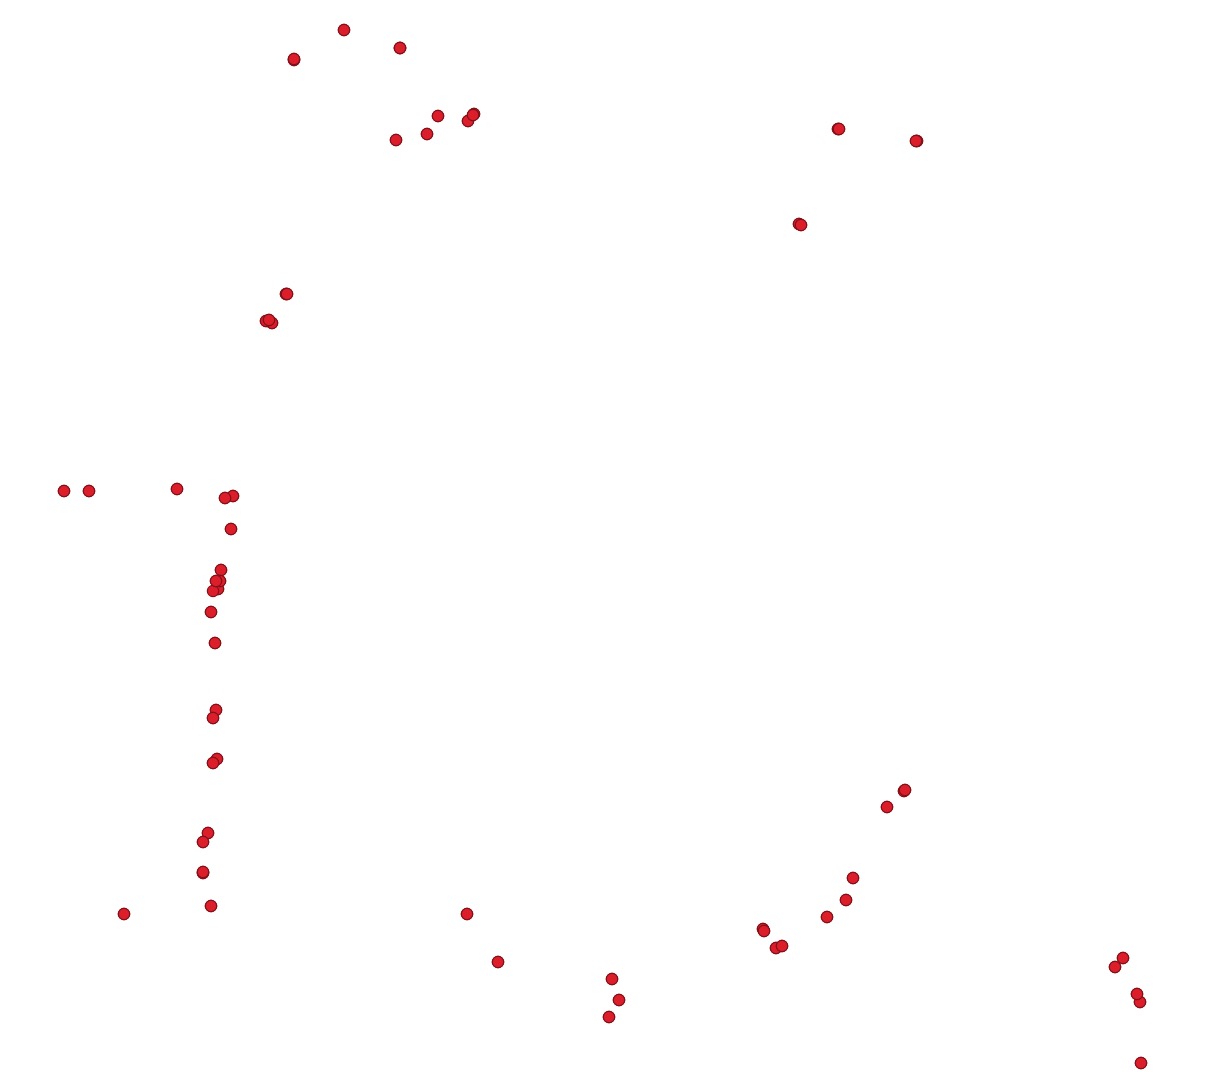
In QGIS I have a point layer of approx. 50 points around a city that represent the on ramps to- and exits off the highway. I would like to calculate the isochrones / service areas of each individual point to see where most car drivers would potentially go if they let's say take 'exit 15' or originate from when taking 'on-ramp 15'.

enter image description here

Using the Valhalla QGIS plugin I'm able to create these isochrones based on travel time. However, these isochrones overlap and I would like to end up with a map that shows the distinct areas that are best served by each individual on ramp and exit. Therefore, ideally I would like to use some sort of method or algorithm that creates these isochrones gradually and stops as soon they touch other isochrones, a bit like a watershed model. Or process these overlapping isochrones afterwards to make them not overlapping. How can I achieve this?

1 Answer 1

1

You can use Voronoi polygons tool under Vector geometry (or a GRASS version of the tool) in qgis to create a diagram of areas closer to each given point. It will not reflect areas that are faster to reach, though, but it will give you a rough approximation of service areas. There is a solution that calculates voronoi diagram based on travel time on roads instead of based on distance in Maptitude GIS (https://www.caliper.com/learning/media/areas-of-influence-and-network-partitions/), but it's not free. I think it might be possible to use ORS routing or QGIS service area calculation to create a custom Python script that calculates an accurate travel time based voronoi isochrones, but it's above my paygrade. If you came to know a better solution, please do let me know.

Your Answer

By clicking “Post Your Answer”, you agree to our terms of service and acknowledge you have read our privacy policy.

Not the answer you're looking for? Browse other questions tagged or ask your own question.