1

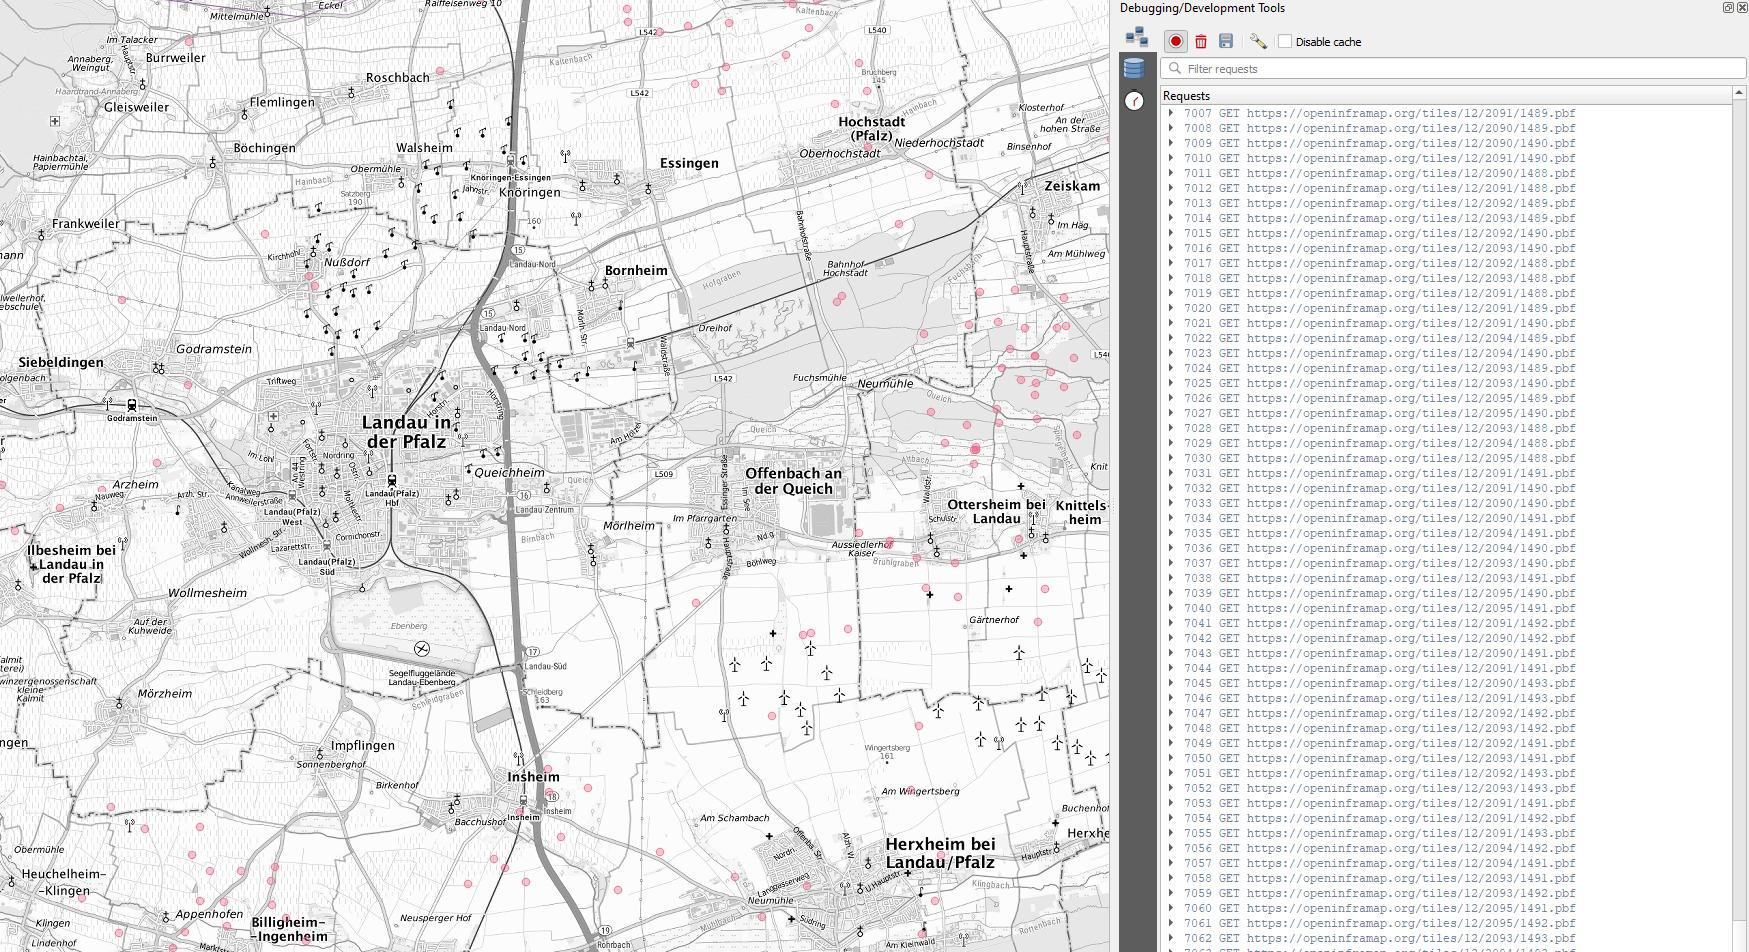
I tried to implement data about power lines etc. derived from open infrastructure map in my own QGIS project. The projected data appears in a completely different style and verbosity The JSON metadata will be uploaded. I used "https://openinframap.org/tiles/{z}/{x}/{y}.pbf" as a new vector tile layer.

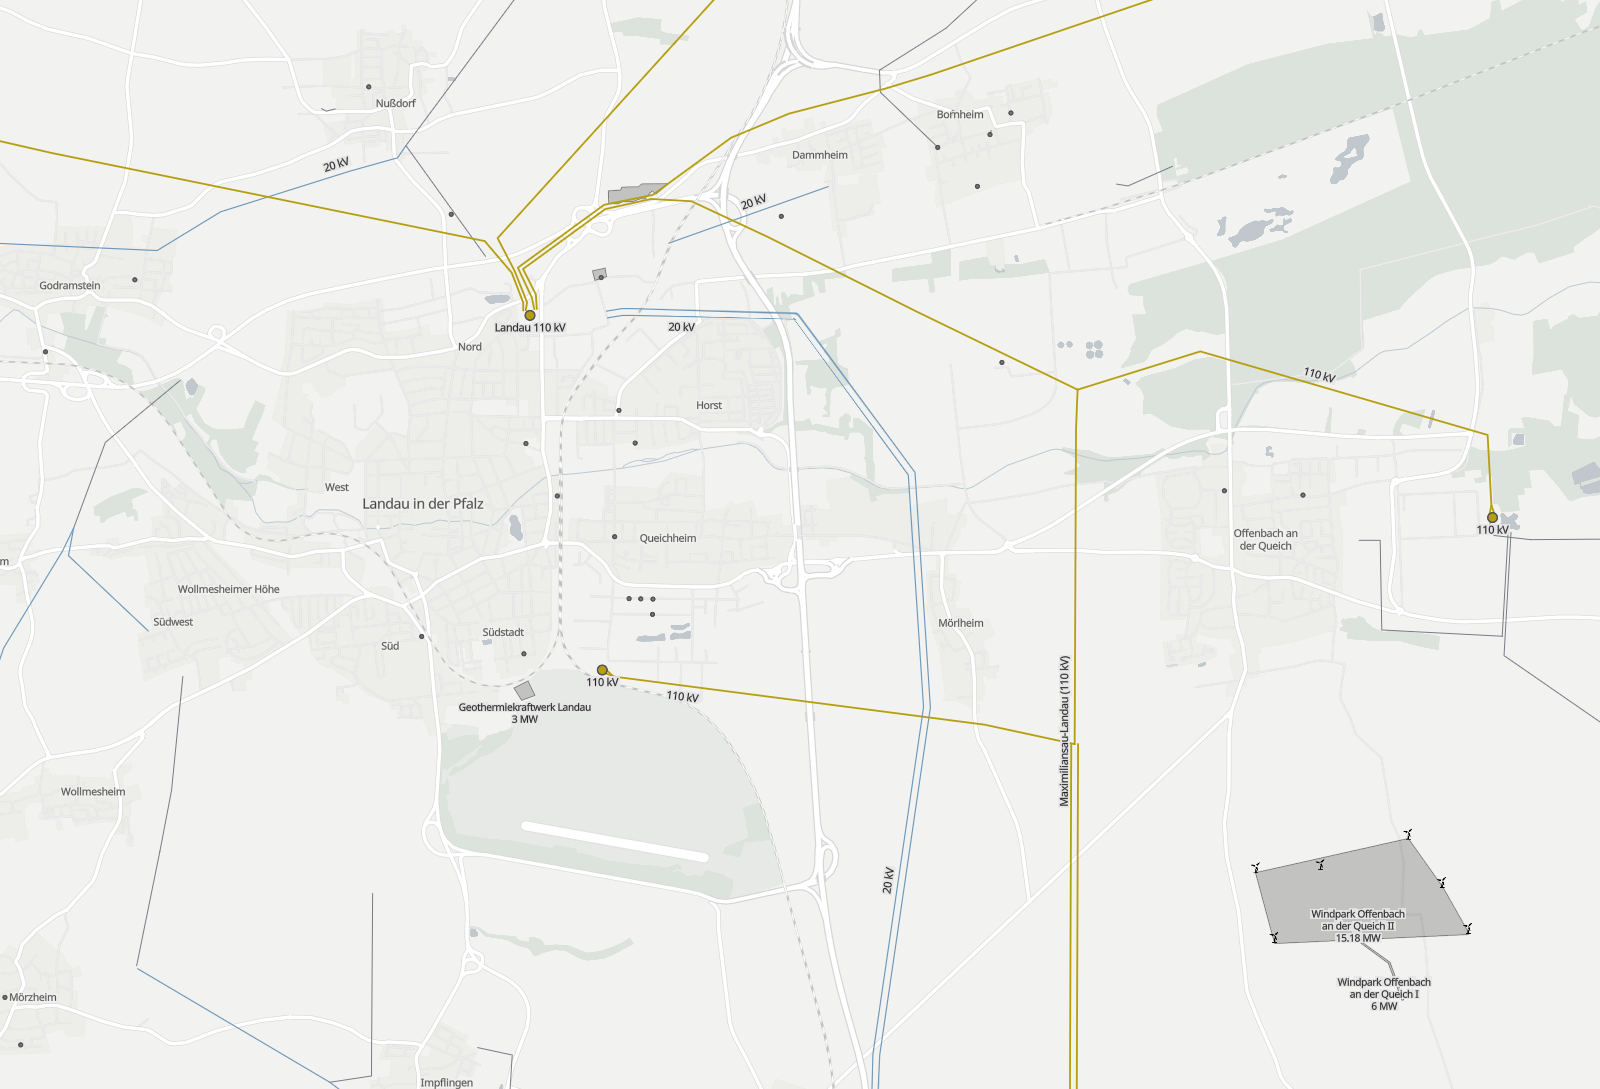
Is it even possible to have the data showed in picture 1 projected in QGIS like I tried in Picture 2?

Open Infrastructure Map (as data source)

How it looks in my QGIS project after adjusting the right CRS

Beneath the code for the tilejson file:

{
  "tilejson": "2.2.0",
  "name": "openinframap",
  "attribution": "<a href=\"https://www.openstreetmap.org/copyright\">© OpenStreetMap contributors</a>, <a href=\"https://openinframap.org/copyright\">OpenInfraMap</a>",
  "bounds": [-180, -85.0511, 180, 85.0511],
  "center": [0, 0, 0],
  "format": "pbf",
  "minzoom": 2,
  "maxzoom": 17,
  "tiles": ["https://openinframap.org/tiles/{z}/{x}/{y}.pbf"],
  "vector_layers": [
    {"id": "power_line", "description": "Power lines and cables", "fields": {}},
    {"id": "power_tower", "description": "Power towers and poles", "fields": {}},
    {"id": "power_substation", "description": "Power substations", "fields": {}},
    {"id": "power_substation_point", "description": "Power substations centroids", "fields": {}},
    {"id": "power_plant", "description": "Power plants", "fields": {}},
    {"id": "power_plant_point", "description": "Power plant centroids", "fields": {}},
    {"id": "power_generator", "description": "Power generators", "fields": {}},
    {"id": "power_generator_area", "description": "Power generators mapped as areas", "fields": {}},
    {"id": "power_heatmap_solar", "description": "Solar generation heatmap points", "fields": {}},
    {"id": "power_transformer", "description": "Power transformers", "fields": {}},
    {"id": "power_compensator", "description": "Power compensators", "fields": {}},
    {"id": "power_switch", "description": "Power switches", "fields": {}},
    {"id": "telecoms_communication_line", "description": "Telecoms lines", "fields": {}},
    {"id": "telecoms_data_center", "description": "Telecoms datacenters and exchanges", "fields": {}},
    {"id": "telecoms_mast", "description": "Communications masts", "fields": {}},
    {"id": "petroleum_pipeline", "description": "Petroleum pipelines", "fields": {}},
    {"id": "petroleum_well", "description": "Petroleum wells", "fields": {}},
    {"id": "petroleum_site", "description": "Petroleum sites", "fields": {}},
    {"id": "water_pipeline", "description": "Water pipelines", "fields": {}}
  ]
}
3
  • 1
    Welcome to Geographic Information Systems! Welcome to GIS SE! We're a little different from other sites; this isn't a discussion forum but a Q&A site. Your questions should as much as possible describe not just what you want to do, but precisely what you have tried and where you are stuck trying that. Please check out our short tour for more about how the site works
    – Ian Turton
    Commented May 22, 2023 at 8:47
  • I only managed to have the pure vector tile connection. No single layers like they are already prescribed within the JSON file can be showed. Also no attribute table is given. Is there any way to have this while implementing a JSON file as vector tile like I did? TY
    – bongoonko
    Commented May 22, 2023 at 9:35
  • QGIS has a special vector tile layer type for MVT style vector tiles docs.qgis.org/3.28/en/docs/user_manual/…. That layer type is different from vector layer. The attributes of the layers in the .pbf files are utilized for rendering rules together with the style file if such is provided. After all, vector tiles are made for rendering, not for delivering geospatial information as data.
    – user30184
    Commented May 22, 2023 at 10:38

1 Answer 1

1

You ask actually several questions.

Reprojecting

Vector tiles are not designed to be reprojected by the client https://github.com/mapbox/vector-tile-spec/tree/master/2.1

A Vector Tile represents data based on a square extent within a projection. A Vector Tile SHOULD NOT contain information about its bounds and projection. The file format assumes that the decoder knows the bounds and projection of a Vector Tile before decoding it.

Web Mercator is the projection of reference, and the Google tile scheme is the tile extent convention of reference. Together, they provide a 1-to-1 relationship between a specific geographical area, at a specific level of detail, and a path such as https://example.com/17/65535/43602.mvt.

Vector Tiles MAY be used to represent data with any projection and tile extent scheme.

The https://openinframap.org/ site seems to deliver data only in the default tiling schema so you are tied into EPSG:3857.

Styles

In vector data the data and styles are separated. In https://openinframap.org/about explains how to get the data part of the vector tiles but not how to get the styles that the site is using. Because QGIS cannot fetch the styles from the service, it does the best it can and applies its own default styles. You can ask from the openinframap support if they are willing to share also the styles. If they are not you must create your own styles by following the specification https://docs.mapbox.com/mapbox-gl-js/style-spec/. Maputnik https://maputnik.github.io/ is an application that helps with creating your own styles.

Your Answer

By clicking “Post Your Answer”, you agree to our terms of service and acknowledge you have read our privacy policy.

Not the answer you're looking for? Browse other questions tagged or ask your own question.