Background: I am working with the R Programming language. I am looking for a shapefile of Canadian Postal Codes - but unfortunately, there is nothing available online for free. Therefore, I had the following idea : I know that there is a free dataset of 10 million fully geocoded Canadian Addresses and each address has a Postal Code and a Longitude/Latitude coordinate. (https://www.statcan.gc.ca/en/lode/databases/oda) - if I were to take all these addresses, perhaps I could somehow try to encircle all longitude/latitude coordinates with the same postal code into their own boundary, and thus derive "approximate" postal code boundaries.
Introduction: To approach this problem, I first asked myself the following question:
Suppose you have 100 longitude/latitude coordinate points - what is the smallest shape that will enclose these 100 points?
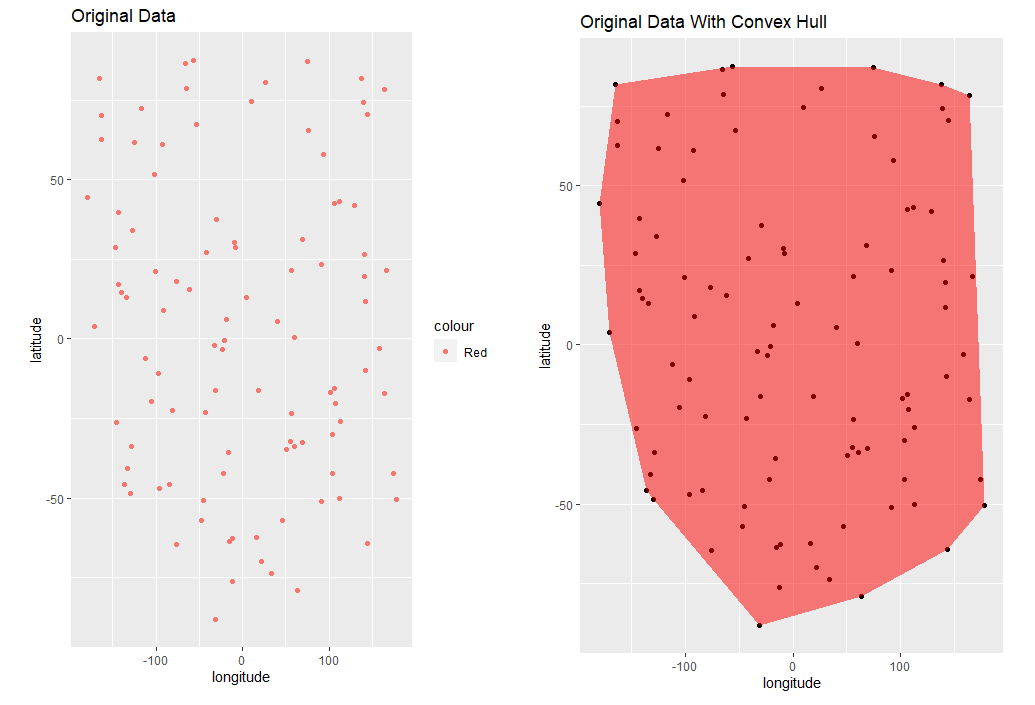
To answer this question, I learned about something called the "Convex Hull" (https://en.wikipedia.org/wiki/Convex_hull) which is exactly this. Here is an example in R of how to determine the convex hull of a given set of points:
library(ggplot2)
library(sf)


# simulate data
set.seed(123)
n <- 100
df <- data.frame(longitude = runif(n, -180, 180),
                 latitude = runif(n, -90, 90))

# find the convex hull
hull <- chull(df$longitude, df$latitude)
hull <- c(hull, hull[1])

# visualize results
p <- ggplot(df, aes(x = longitude, y = latitude)) +
  geom_point() +
  geom_polygon(data = df[hull, ], aes(x = longitude, y = latitude), fill = "red", alpha = 0.5)


# optional : convert to shapefile
hull_df <- df[hull, ]

# optional : convert to shapefile
hull_sf <- st_as_sf(hull_df, coords = c("longitude", "latitude"), crs = 4326)
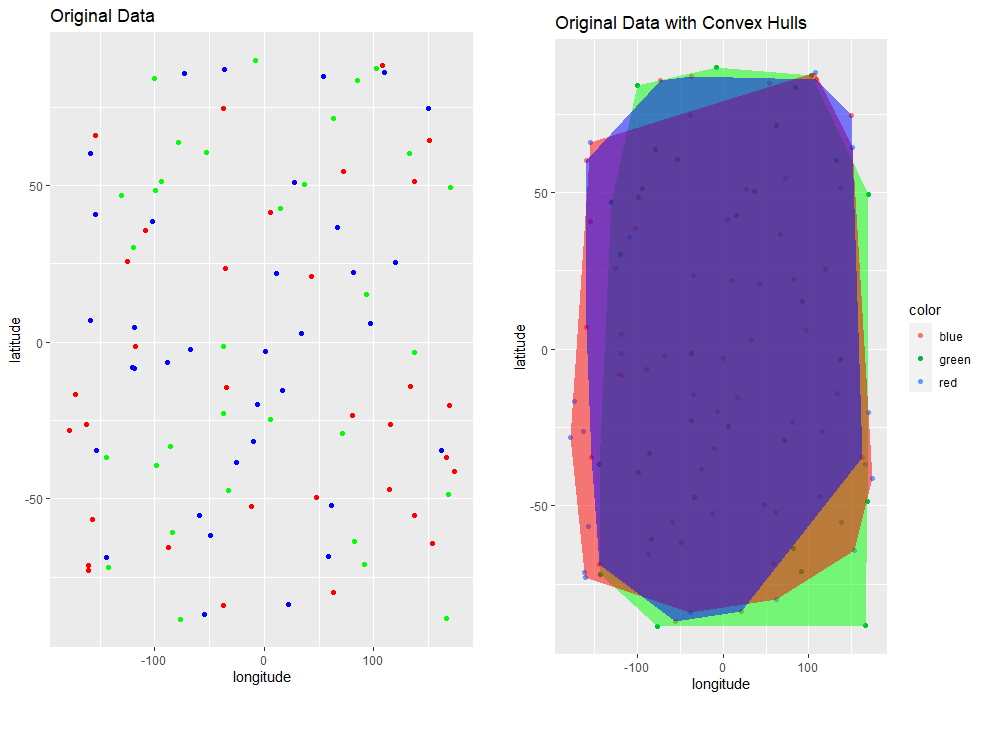
My Question: Suppose I have a similar problem - but now are there different "classes" of points (e.g. red class, blue class, green class - these represent the Postal Codes). Now, I want to identify 3 convex hulls - but I want none of the convex hulls to overlap with each other.
When I tried to do this:
set.seed(123)
n <- 100
df <- data.frame(longitude = runif(n, -180, 180),
                 latitude = runif(n, -90, 90),
                 color = sample(c("red", "blue", "green"), n, replace = TRUE))

# Find the convex hull of the points for each color class
hulls <- lapply(unique(df$color), function(color) {
  chull(df[df$color == color, c("longitude", "latitude")])
})

# Create scatter plot with convex hulls
p <- ggplot(df, aes(x = longitude, y = latitude)) +
  geom_point(aes(color = color)) +
  lapply(seq_along(hulls), function(i) {
    geom_polygon(data = df[df$color == unique(df$color)[i], ][hulls[[i]], ],
                 aes(x = longitude, y = latitude), fill = unique(df$color)[i], alpha = 0.5)
  })


# optional steps
hull_sfs <- lapply(seq_along(hulls), function(i) {
  st_as_sf(df[df$color == unique(df$color)[i], ][hulls[[i]], ],
           coords = c("longitude", "latitude"), crs = 4326)
})


hull_sf_combined <- do.call(rbind, hull_sfs)


st_write(hull_sf_combined, "hulls.shp")
Problem: As we can see here - the convex hulls for the different color classes were identified, but they all overlap with each other now. As such, is there any way around this?
Note: Is the "Concave Hull" a better choice for this kind of problem?
library(concaveman)

# find concave hull
concave_hull <- concaveman(as.matrix(df))
concave_hull_df <- as.data.frame(concave_hull)
names(concave_hull_df) <- c("x", "y")


# scatter plot with concave hull
p2 <- ggplot(df, aes(x = x, y = y)) +
  geom_point() +
  geom_polygon(data = concave_hull_df, aes(x = x, y = y), fill = "blue", alpha = 0.5) +
  ggtitle("Concave Hull")
References:


