3

Extending this question and this one: In QGIS, there are special expression functions for the first and third quartile (q1 and q3) and as well as median (median). So it's easily possible to categorise the values of a field into the first 25% (the quarter of the features with the lowest values), the second quartile (25% to 50%) etc.

However, if I want to categorize not in categories of quartiles, but any arbitrary number of percentiles (e.g. "septiles": the first 7%, the second 7% etc.): how can I do that and assign a value to each feature that shows to which group it belongs?

Bonus: if I could set the range not to a fixed percentile, but define the "range" manually (like e.g. 0% to 7%, 7% to 19%, 19% to 23% etc.), that would be perfect.

2 Answers 2

4

You can use the following expression to categorize your field values into any arbitrary number of percentile (n-tiles, so to say), like e.g. into 7 categories: when you have 140 features, the 20 features with the lowest values are the first category, the features with the next heigher 20 values category 2 etc.

The only thing you have to adapt is A) replace "fieldname" with the name of the field you use (line 18) and B) change the names and number of the output categories (line 3). Based on the number of elements you define there, the rest of the expression automatically calculates the right size of the categories. In the following example, I have 7 categories defined:

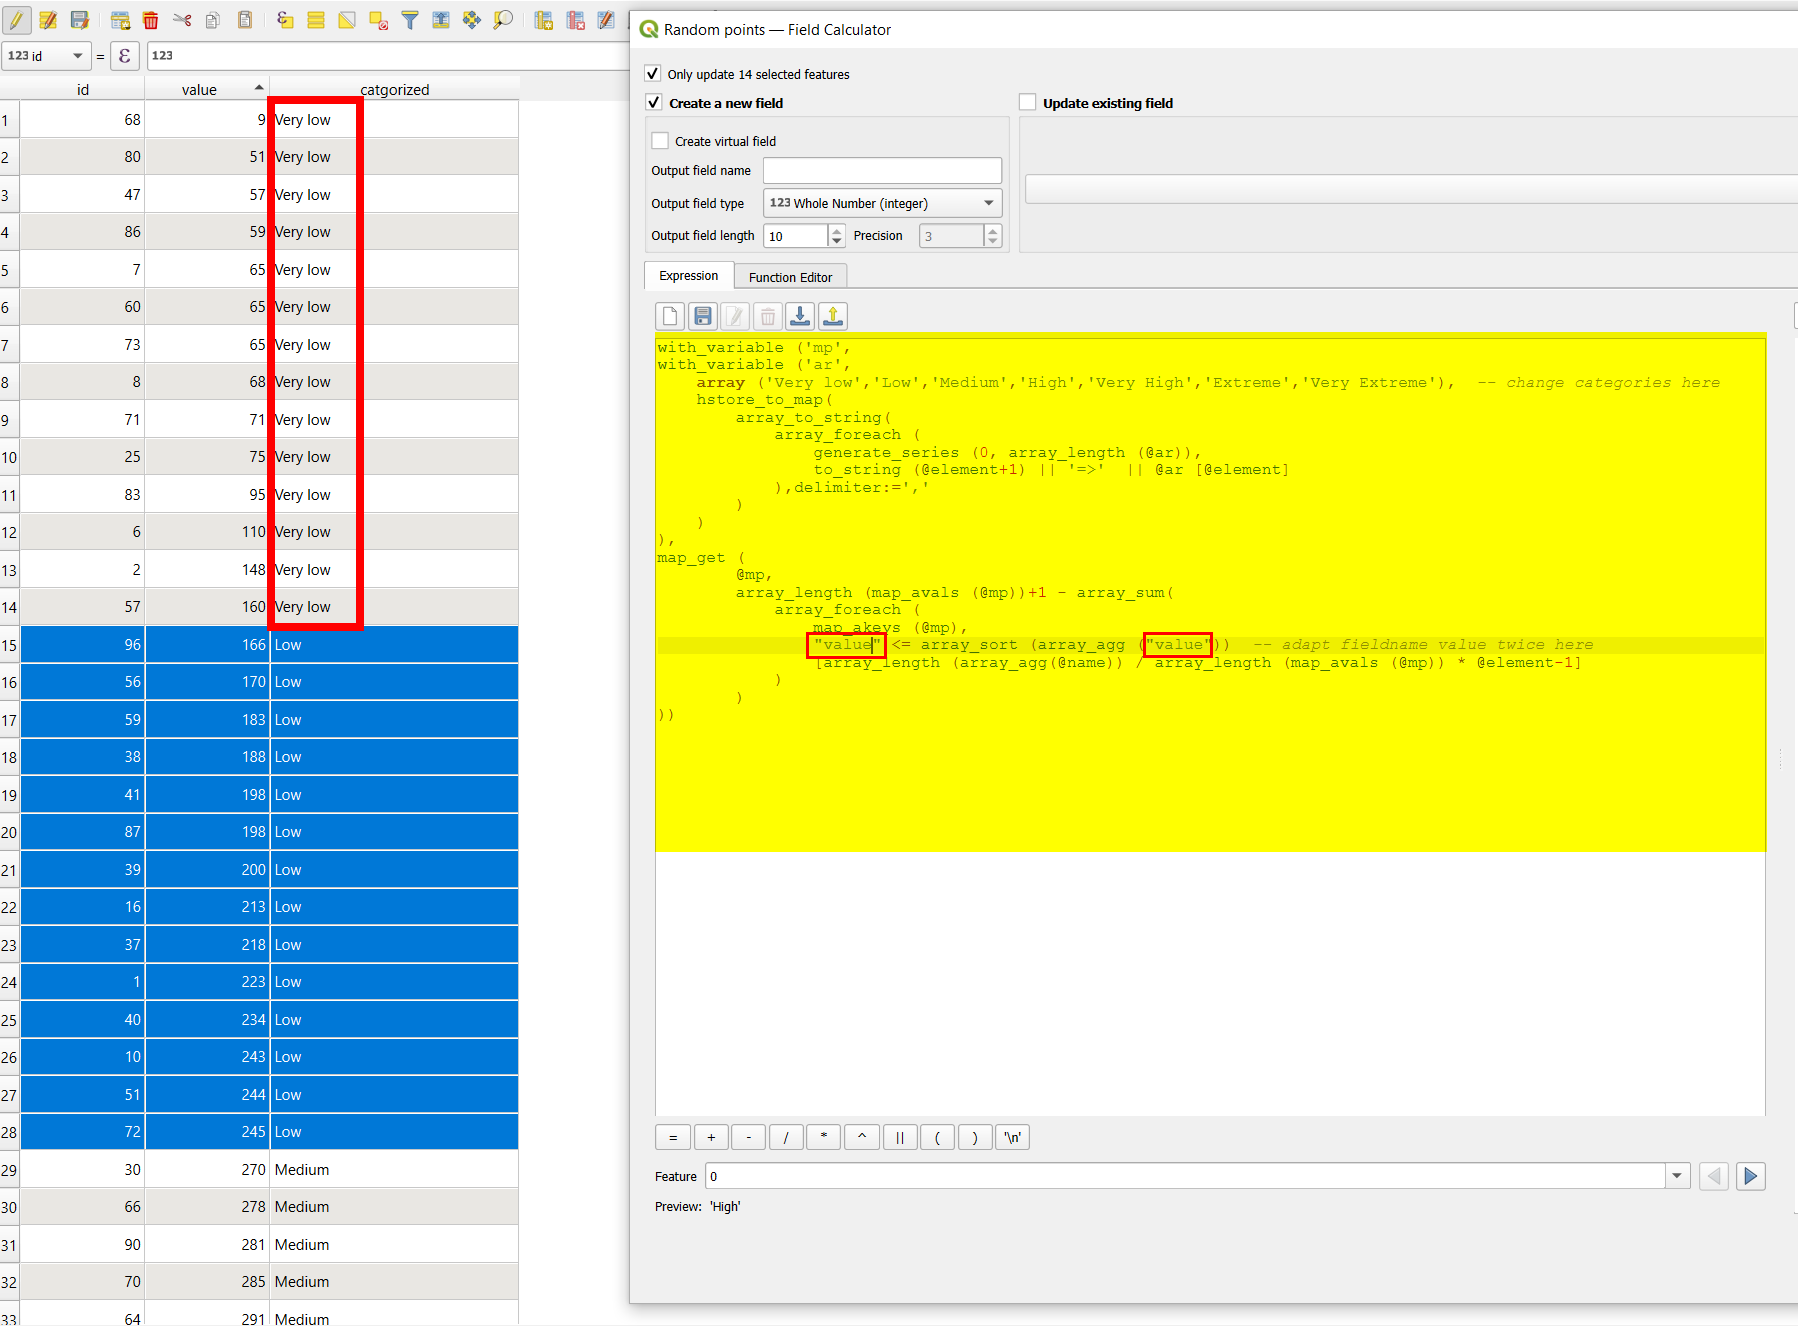
Running the expression on a layer with 99 features and 7 categories groups the 14 lowest values to the first category, the next 14 values to the second category etc.: enter image description here

with_variable ('mp',
with_variable ('ar',
    array ('Very low','Low','Medium','High','Very High','Extreme','Very Extreme'),  -- change categories here
    hstore_to_map( 
        array_to_string(
            array_foreach (
                generate_series (0, array_length (@ar)),
                to_string (@element+1) || '=>'  || @ar [@element]
            ),delimiter:=','
        )
    )
),
map_get (
        @mp,
        array_length (map_avals (@mp))+1 - array_sum(
            array_foreach (
                map_akeys (@mp),
                "fieldname" <= array_sort (array_agg ("fieldname"))  -- adapt fieldname value twice here
                [array_length (array_agg(@name)) / array_length (map_avals (@mp)) * @element-1]
            )
        )
))
3

Another answer is to make a custom python function in the advanced field calculator:

from qgis.core import *
from qgis.gui import *
import numpy as np

@qgsfunction(args='auto', group='Custom')
def assign_to_group(value, field_values, percentiles, feature, parent):
    # Convert the percentiles string to a list of integers
    percentiles = [int(p) for p in percentiles.split(',')]
    data_values = [float(val) for val in field_values]
    thresholds = np.percentile(data_values, percentiles)
    # Determine the group for the given value
    group = np.digitize(value, thresholds, right=True)
    return int(group)

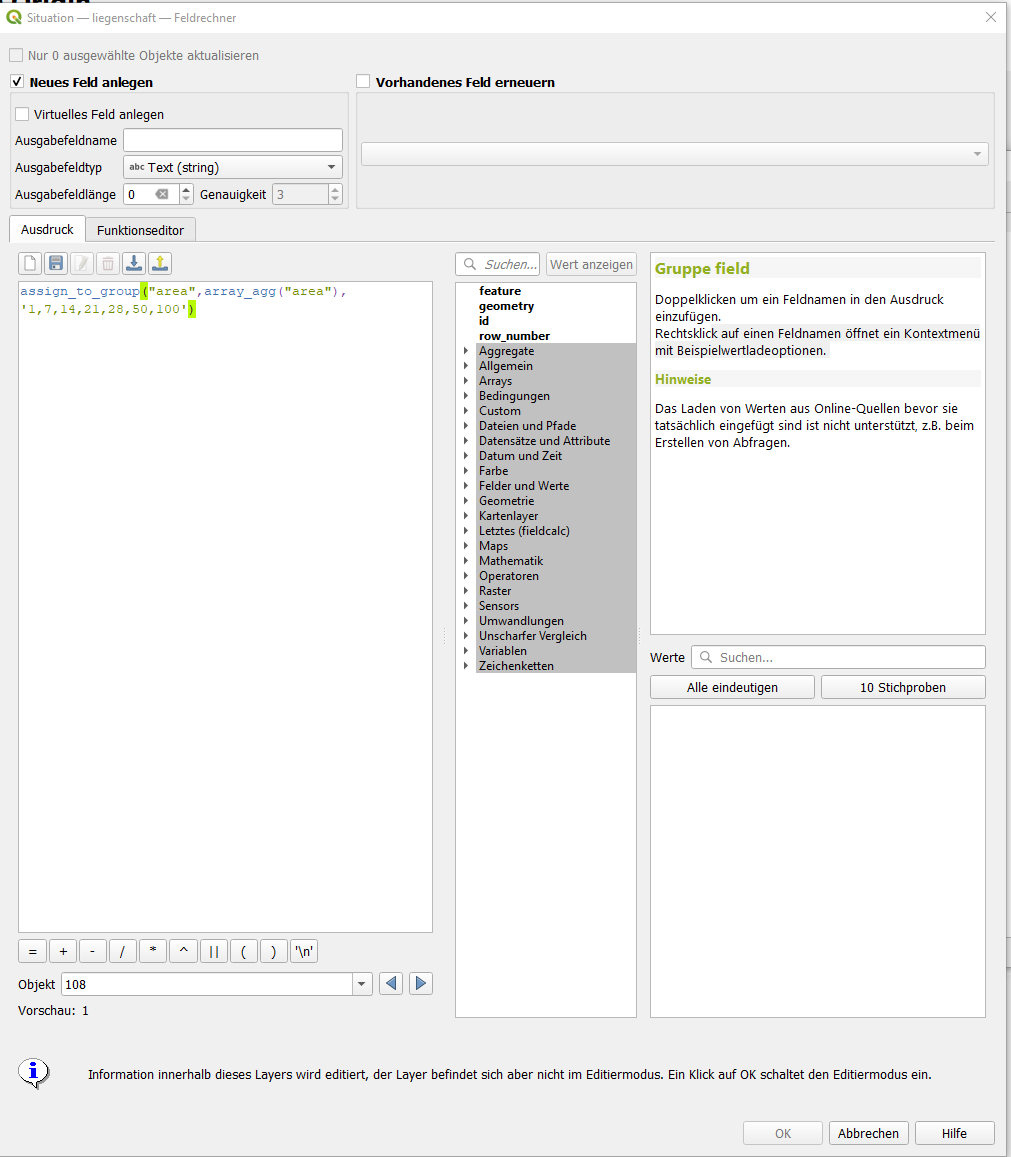
With the following expression you can create a new field with the categories you want: enter image description here

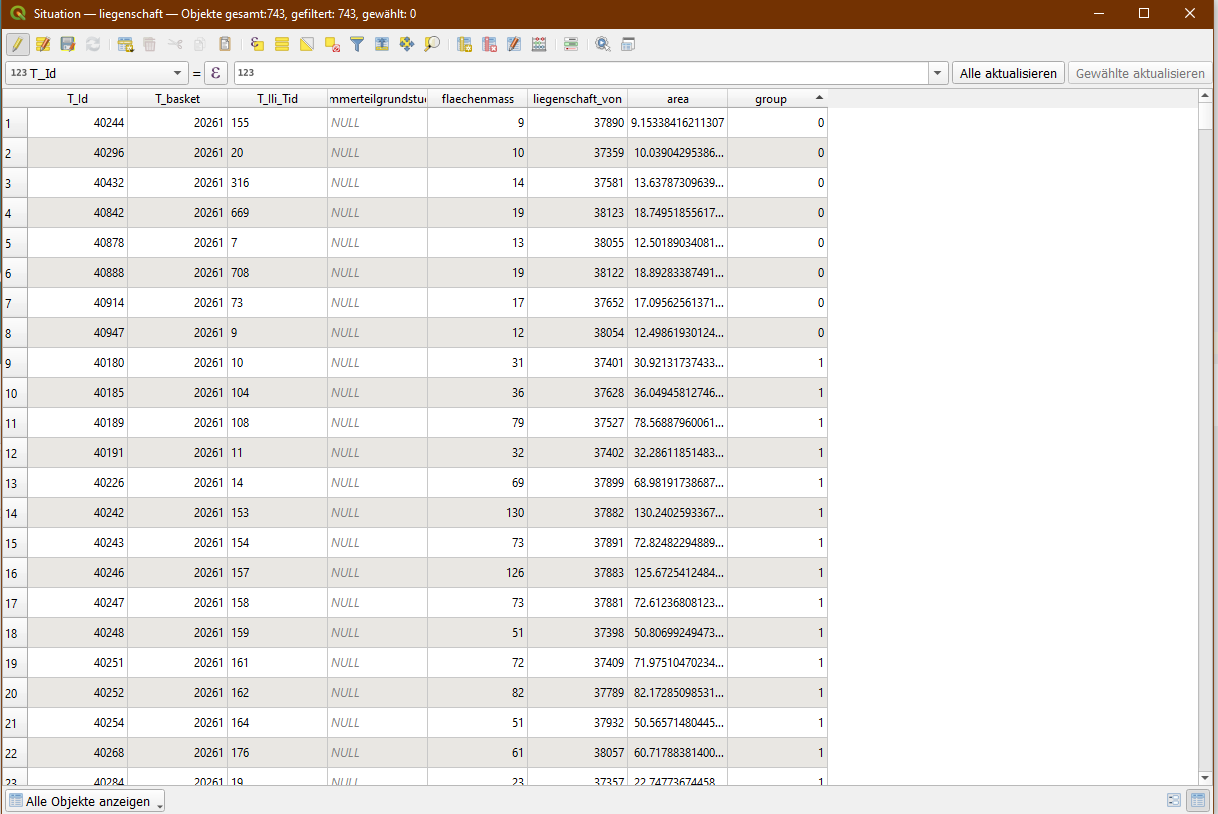
The output is the number of the group the point belongs to. As an output we can see, that it successfully calculated each group:

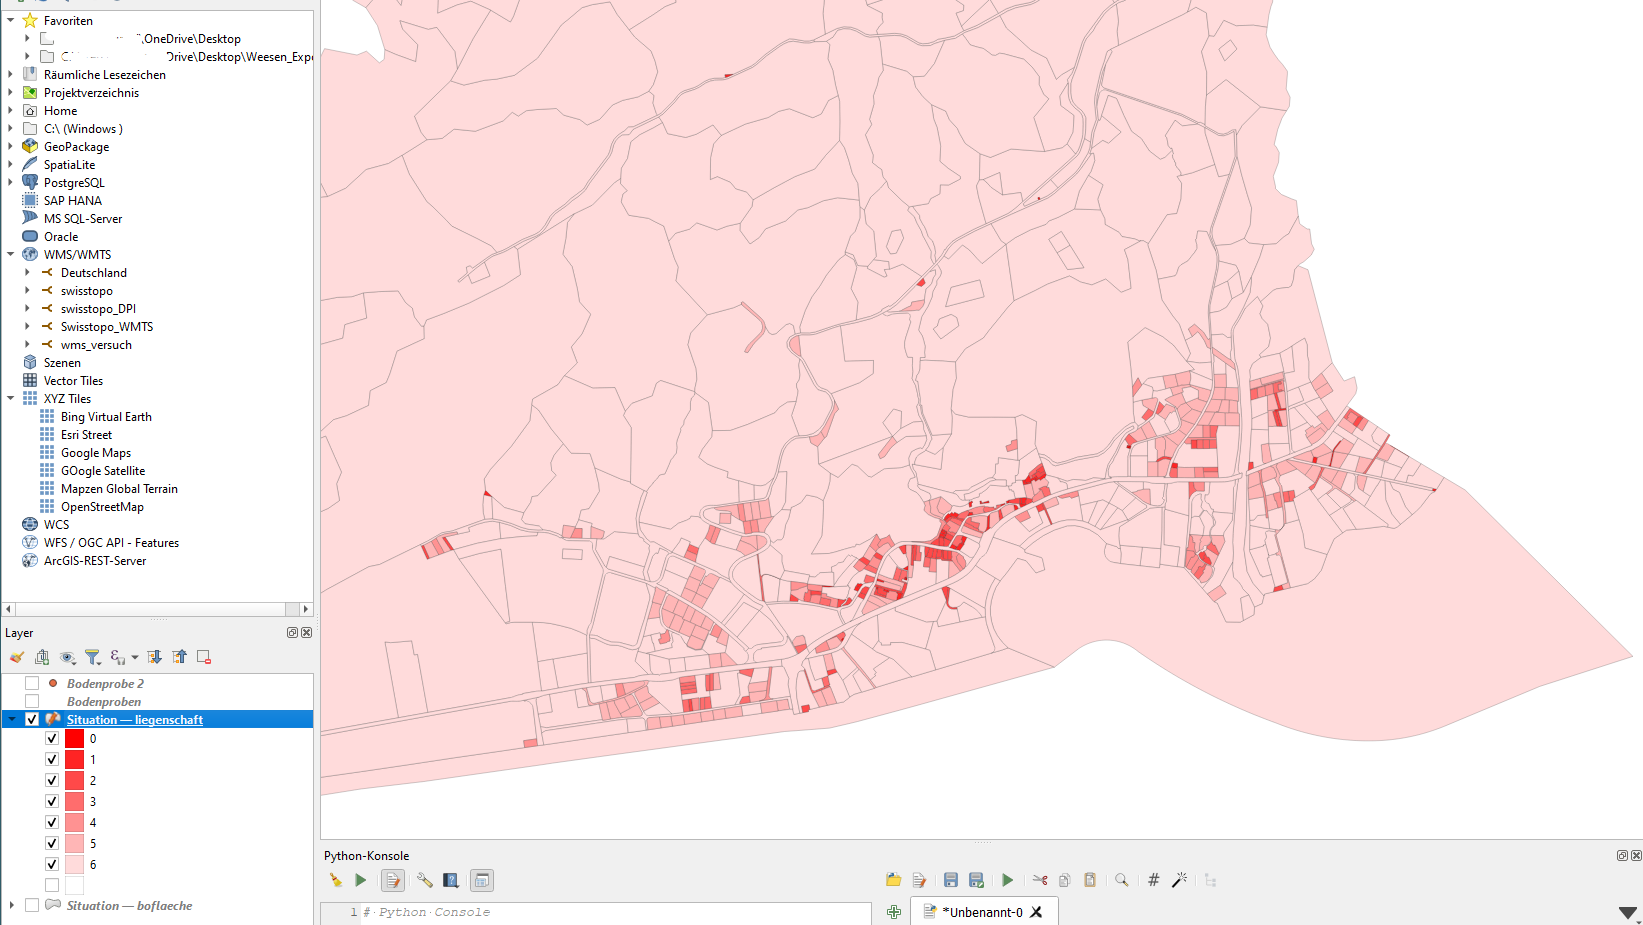
enter image description here enter image description here

I hope this helps :)

0

Your Answer

By clicking “Post Your Answer”, you agree to our terms of service and acknowledge you have read our privacy policy.

Not the answer you're looking for? Browse other questions tagged or ask your own question.