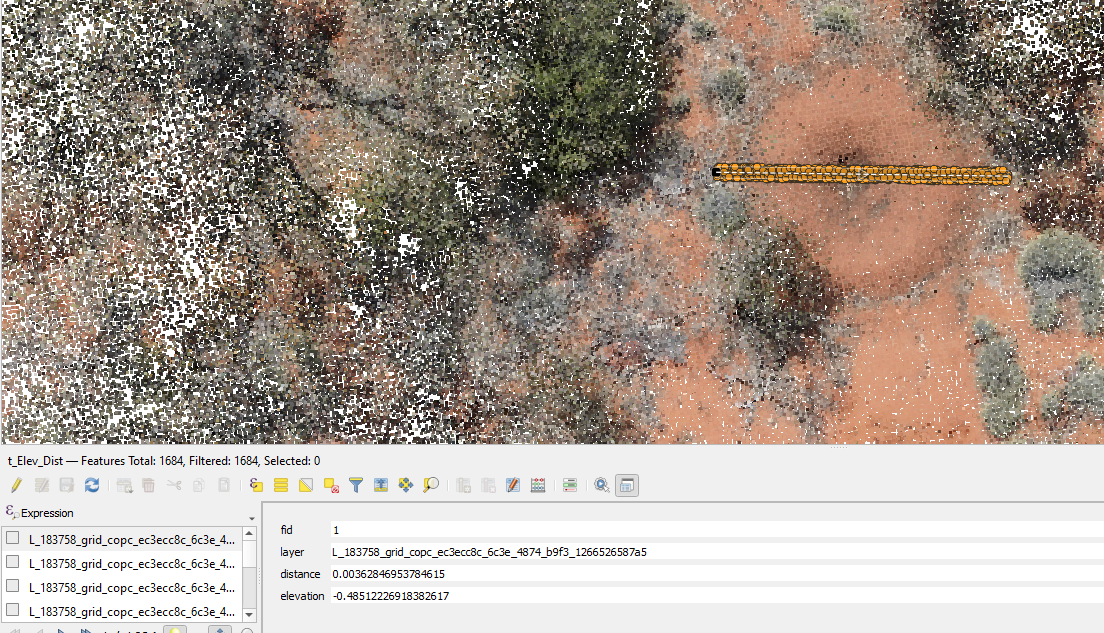
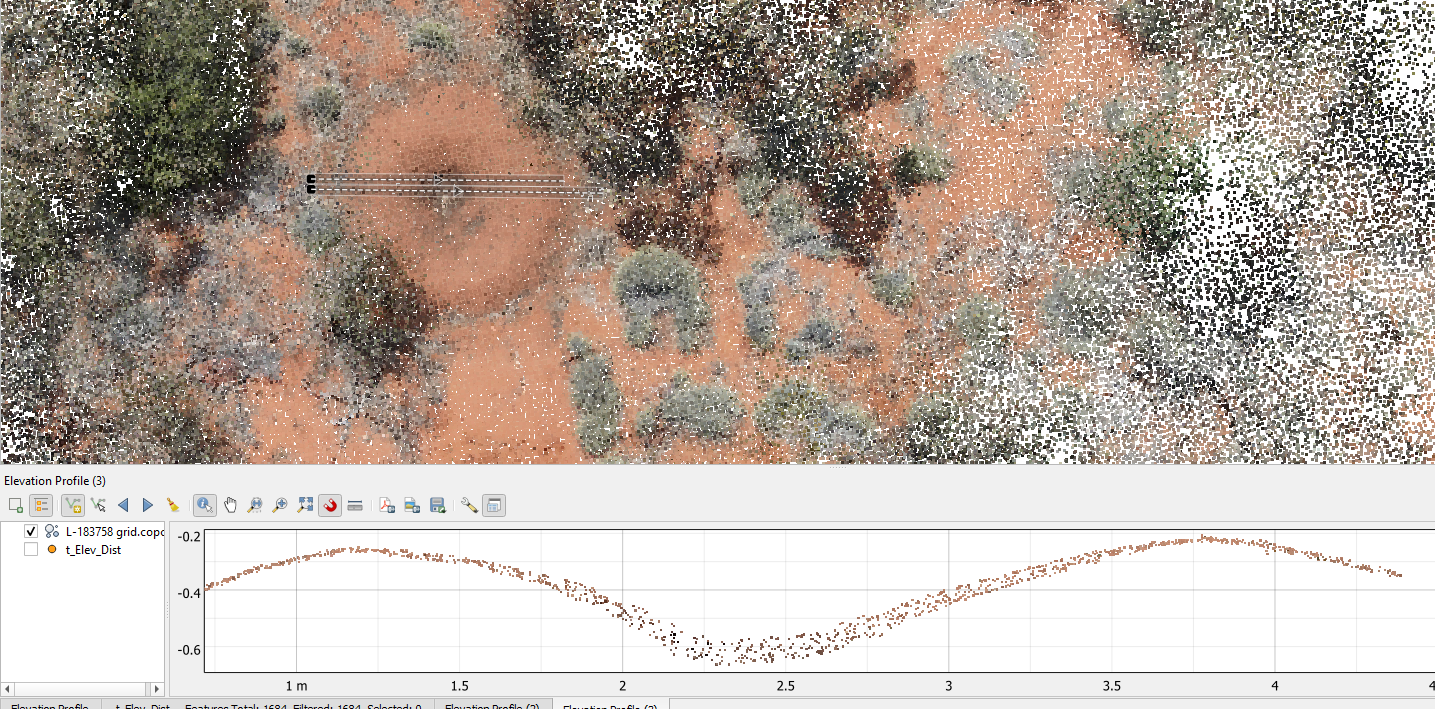
When I run an elevation profile in the current Dev of QGIS I get the graph as expected but if I save to gpkg, it creates a point dataset to which I can then add the x and y but how do I get the intensity, return, r,g.b etc as in the output from ODM (example below).
And finally,can this export process be accessed via python? so I supply a file with lines it can loop through and export the profile along each line.
EXPORT from QGIS - Elevation view (Distance/Elevation table)


