2

I have multiple folders containing landsat data from different years enter image description here. I have been just testing Landsat 5 before doing them all but I feel as though something is wrong with the code.
def calculate_ndvi_from_multiband_tiff(multiband_tiff_path, output_folder, red_band_index, nir_band_index):
    # Create the output folder if it doesn't exist
    os.makedirs(output_folder, exist_ok=True)

    # Open the multi-band GeoTIFF
    with rasterio.open(multiband_tiff_path) as src:
        # Read the red and NIR bands
        red = (src.read(red_band_index).astype('float32') * 0.0000275) + -0.2
        nir = (src.read(nir_band_index).astype('float32') * 0.0000275) + -0.2
        
        # Avoid division by zero
        np.seterr(divide='ignore', invalid='ignore')

        # Calculate NDVI
        ndvi = (nir - red) / (nir + red)

        # Save the NDVI image
        profile = src.profile
        profile.update(dtype=rasterio.float32, count=1)

        # Construct the output path for NDVI image
        base_filename = os.path.splitext(os.path.basename(multiband_tiff_path))[0]
        ndvi_output_filename = f'{base_filename}_NDVI.tif'
        ndvi_output_path = os.path.join(output_folder, ndvi_output_filename)
        
        with rasterio.open(ndvi_output_path, 'w', **profile) as dst:
            dst.write(ndvi, 1)

    print(f'NDVI calculation complete. Output saved to {ndvi_output_path}')

def process_landsat_folder(input_folder, output_root_folder):
    # Create the output root folder if it doesn't exist
    os.makedirs(output_root_folder, exist_ok=True)

    # Iterate over all files in the input folder
    for filename in os.listdir(input_folder):
        if filename.endswith('.tif') or filename.endswith('.tiff'):
            multiband_tiff_path = os.path.join(input_folder, filename)
            
            # Landsat 5: typically Red is Band 3 and NIR is Band 4
            red_band_index = 3
            nir_band_index = 4

            calculate_ndvi_from_multiband_tiff(multiband_tiff_path, output_root_folder, red_band_index, nir_band_index)

# # Example usage
input_folder = "D:\PPR Downloads (Test)\Landsat_5_2005_05_09"
output_root_folder = "D:\Landsat_NDVI\Landsat_5_2005_NDVI"

process_landsat_folder(input_folder, output_root_folder)

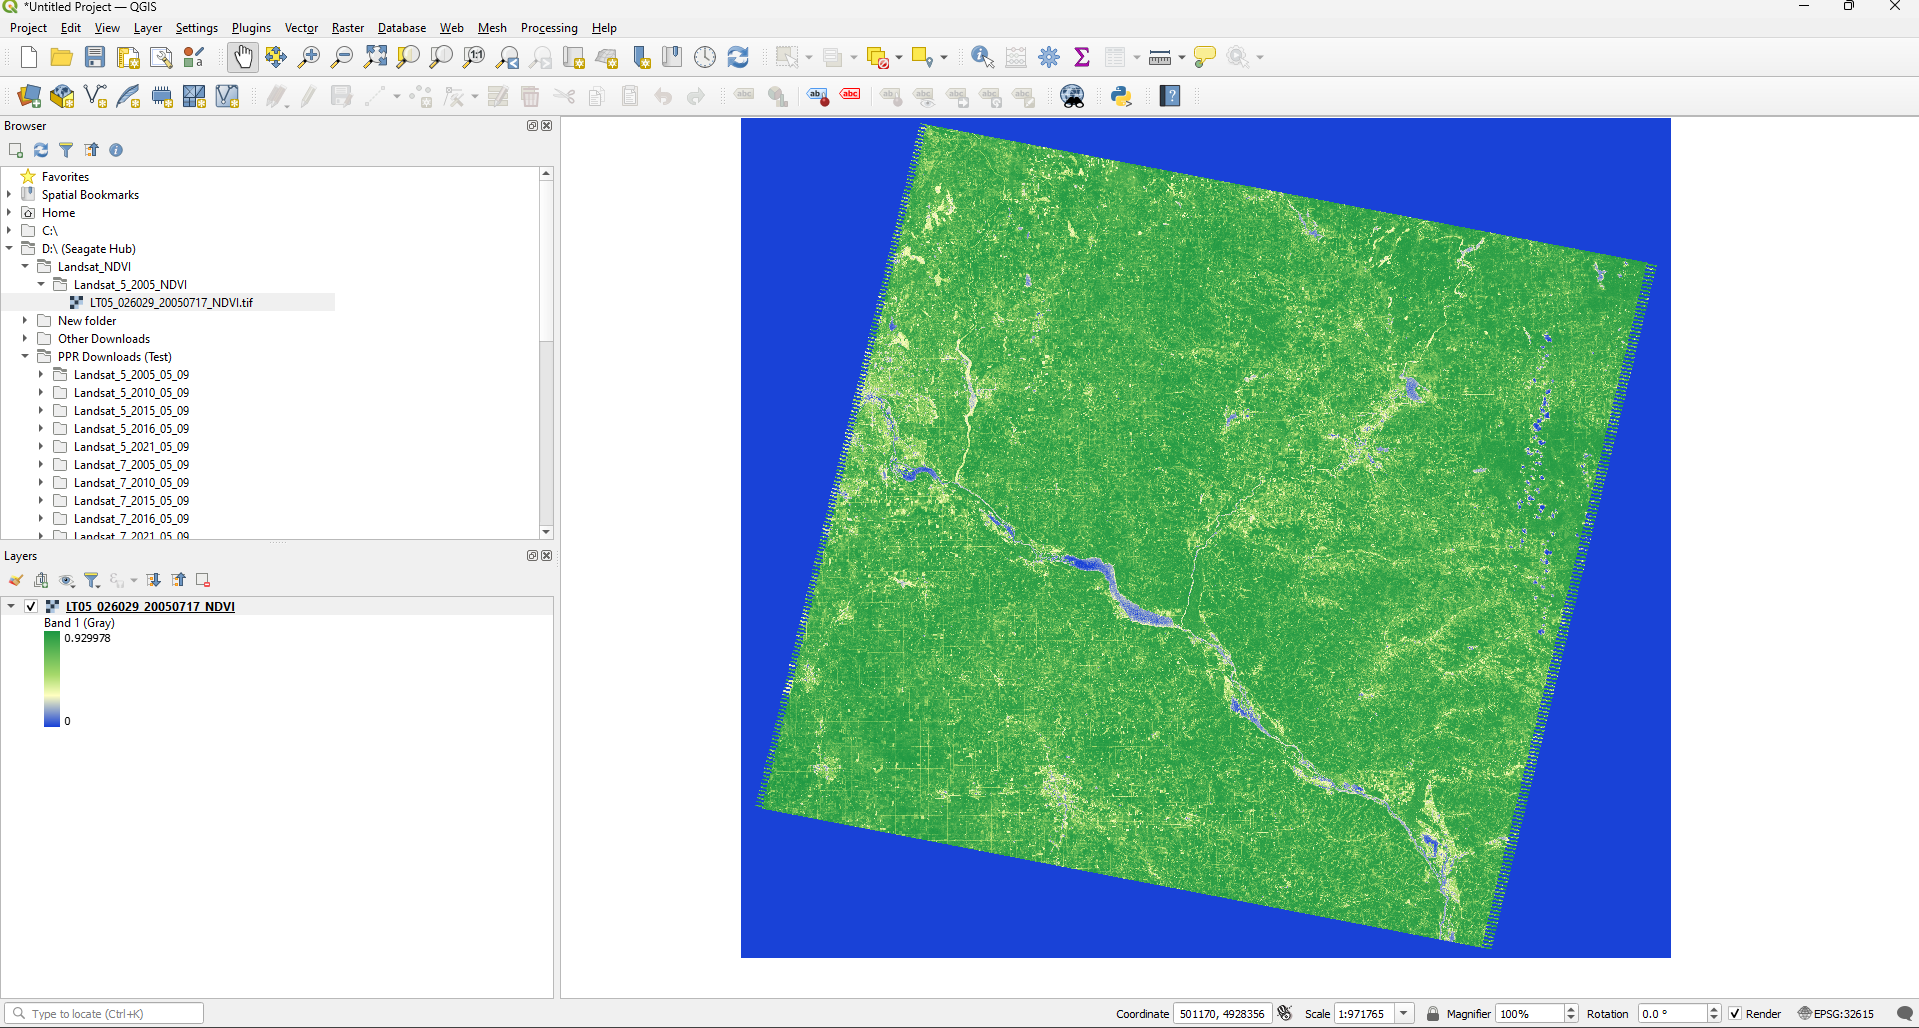
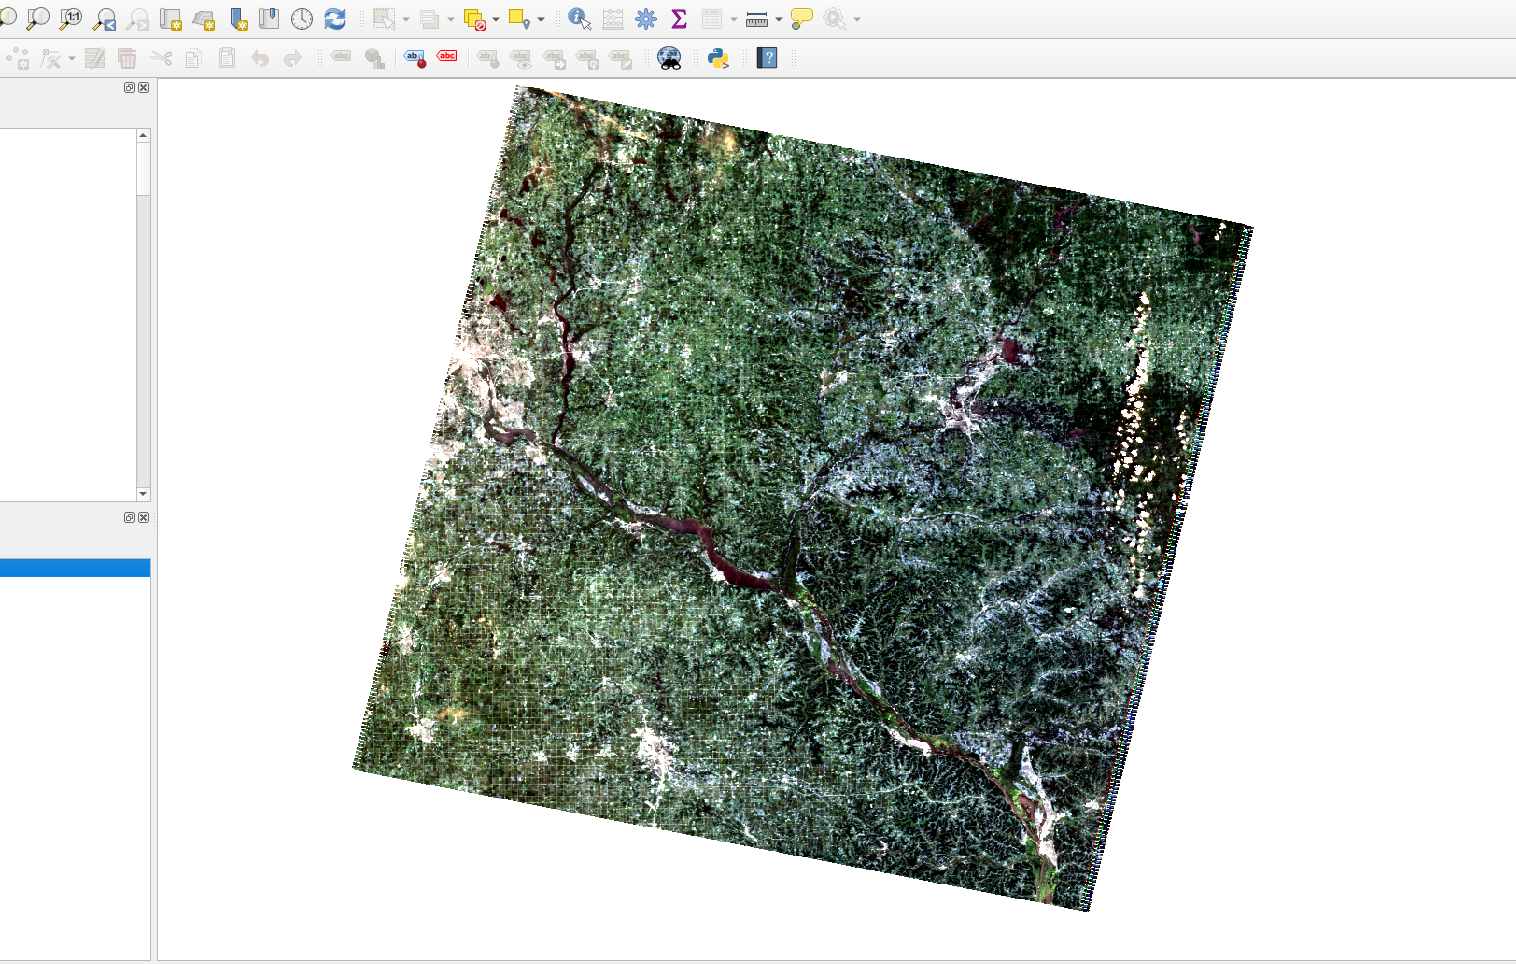
I am not the best with python, I understand the basics but as soon as I start adding packages I am not to sure what to do so I turn to Chat GPT for help. So the code does not always work but after changing a few things it actually did the calculations from a single Landsat which is nice. I had to apply the scaling factors and what not but when I import just one tile into QGIS to make sure the calculations are correct and a few things stood out to me.

The first thing was that the Tile had been filled in from its negative space, which if I could avoid I would like to.

Second is that what which should have a NDVI value of <0 was not fully showing?

Calculated NDVI using code, and Original Landsat downloaded

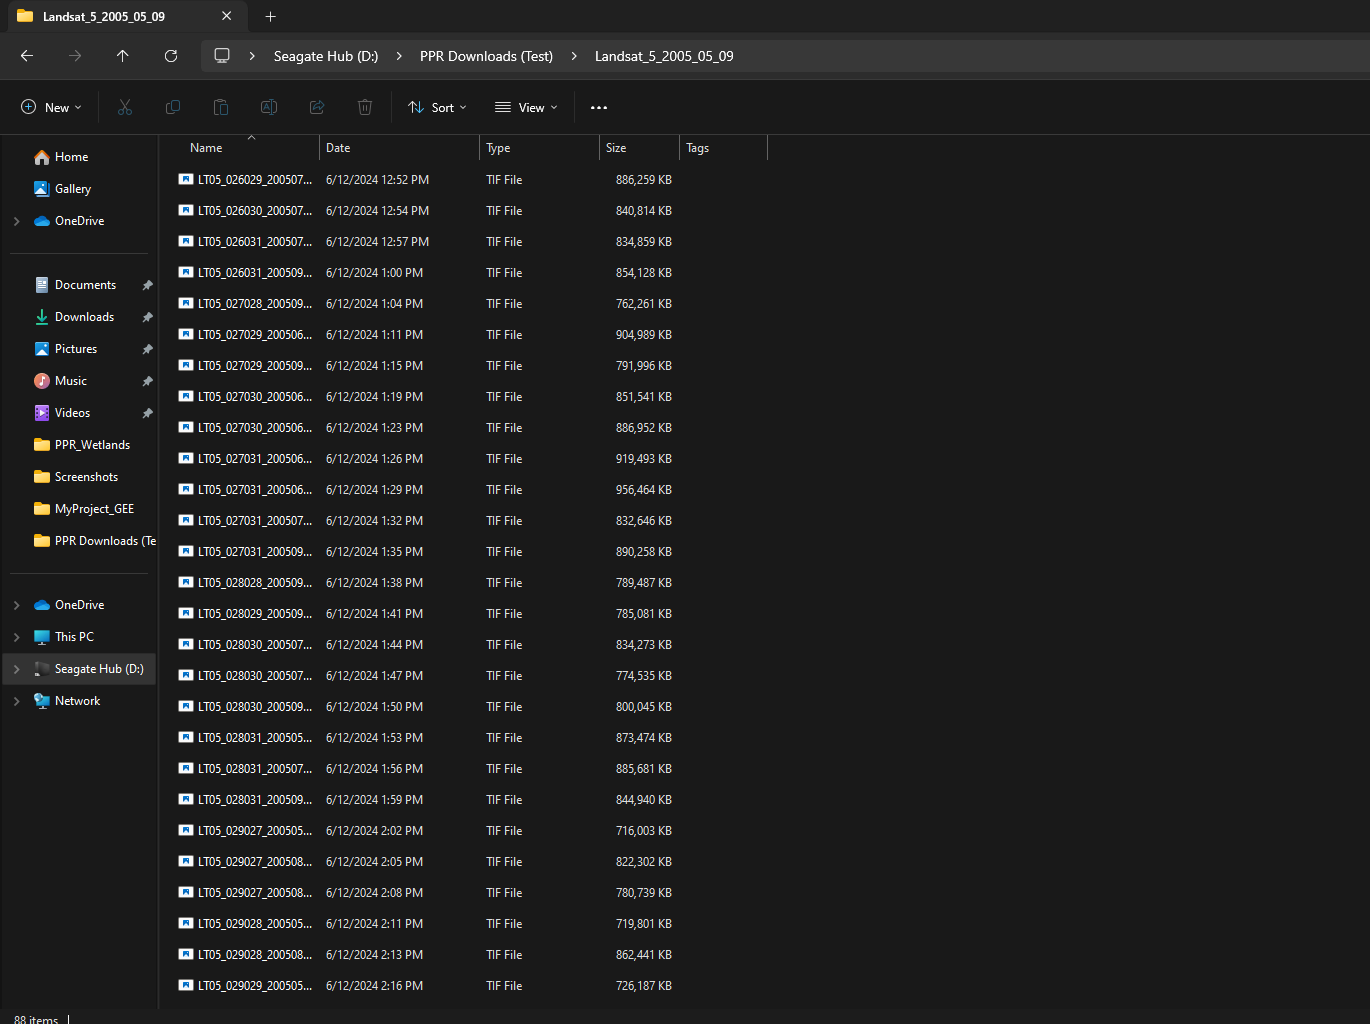
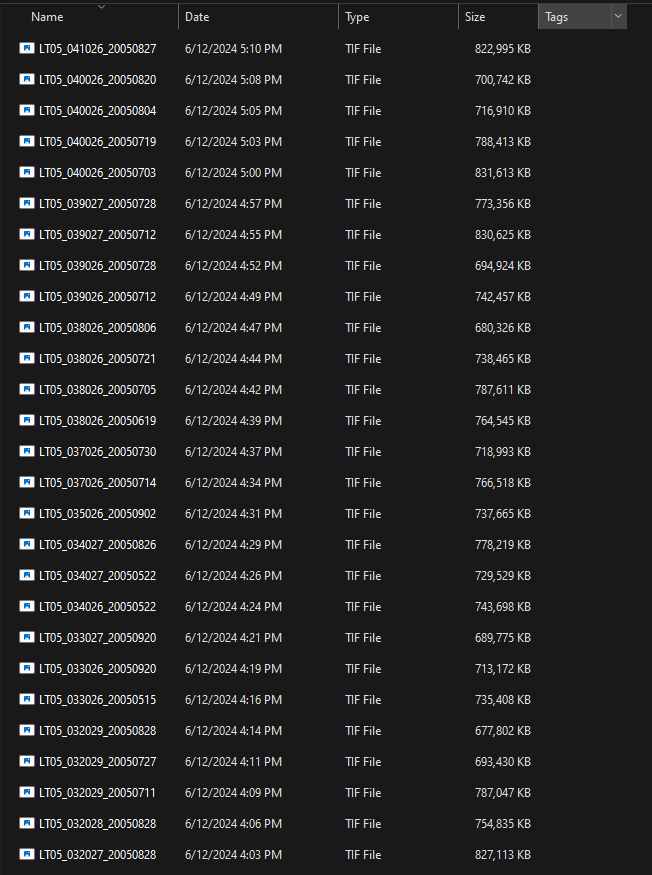
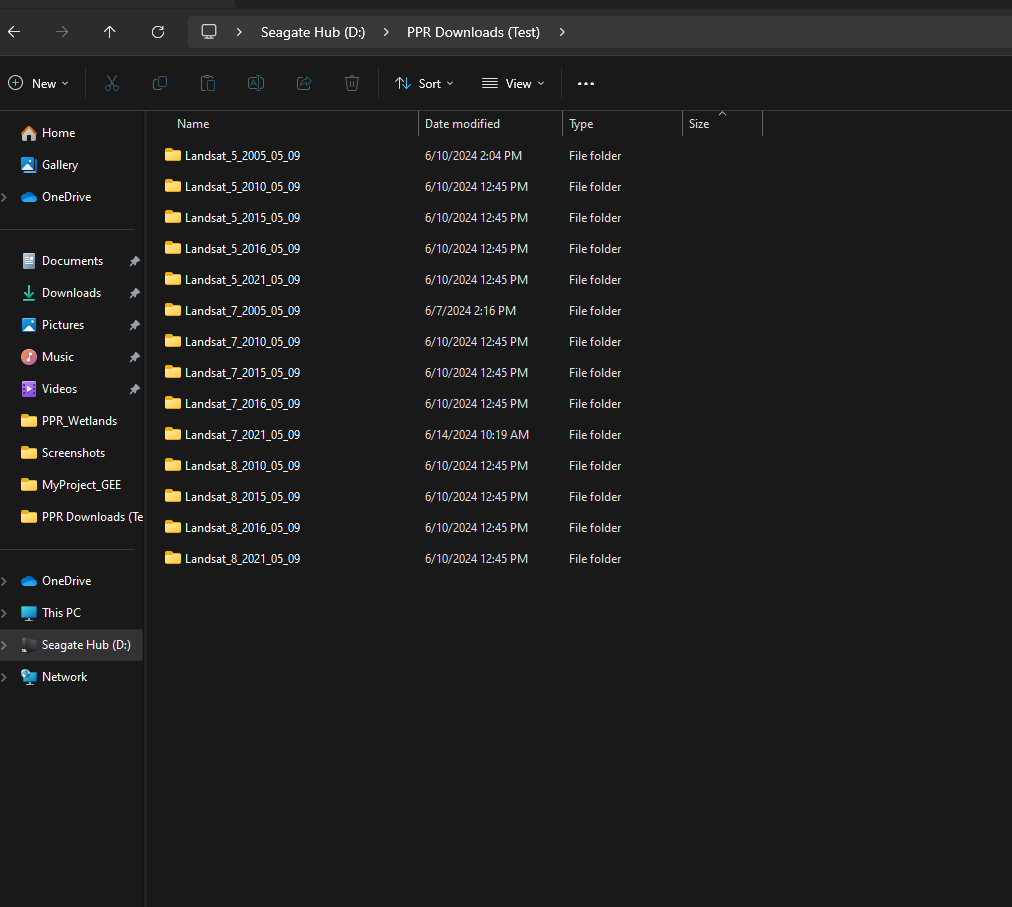
One of the directories looks like this enter image description hereenter image description here

10
  • Can you show the contents of one of your 'Landsat_5_yyyy_mm_dd' directories? Landsat data can be downloaded in several different formats, just want to confirm that what you have are multi-band tiffs with reflectance data and not something else.
    – Kartograaf
    Commented Jun 17 at 17:12
  • Generally, I think you will be better off writing a function that can reliably process one dataset before you try to abstract on multiple sensor products and loop though everything.
    – Kartograaf
    Commented Jun 17 at 17:14
  • @Kartograaf Yes I can Commented Jun 17 at 17:17
  • 1
    @Kartograaf I got them from GEE from "LANDSAT/LT05/C02/T1_L2" Commented Jun 17 at 17:46
  • 1
    @Kartograaf I added that as the scaling factor for the bands Commented Jun 17 at 18:46

1 Answer 1

1

To replicate your data, I used this code on GEE, where 'geometry' is a polygon that covers the whole USA:

// Load a landsat image and select three bands.
var landsat = ee.Image('LANDSAT/LT05/C02/T1_L2/LT05_041026_20050827').select(['SR_B1', 'SR_B2', 'SR_B3', 'SR_B4', 'SR_B7'])

// Retrieve the projection information from a band of the original image.
// Call getInfo() on the projection to request a client-side object containing
// the crs and transform information needed for the client-side Export function.
var projection = landsat.select('SR_B1').projection().getInfo();

// Export a cloud-optimized GeoTIFF.
Export.image.toDrive({
  image: landsat,
  description: 'imageToCOGeoTiffExample',
  crs: projection.crs,
  crsTransform: projection.transform,
  region: geometry,
  fileFormat: 'GeoTIFF',
  formatOptions: {
    cloudOptimized: true
  }
});

One key thing to note is that I'm only getting the bands that contain reflectance values (B1, B2, B3, B4, and B7). Since you are looking to make NDVI, you only need B3 (red) and B4 (near-ir).

Using the multiband .tif from GEE, I made small modifications to your first function (calculate_ndvi_from_multiband_tiff()) so you can use it to loop through a folder with many such files and output the resulting NDVI rasters.

You will need to make sure the 'data' and 'output' directories match up with the respective place you want to read from and write to.

import os
import rasterio
import numpy as np
import glob
import matplotlib.pyplot as plt

def calculate_ndvi_from_multiband_tiff(multiband_tiff_path, output_folder, red_band_index, nir_band_index):
    # Create the output folder if it doesn't exist
    os.makedirs(output_folder, exist_ok=True)

    # Open the multi-band GeoTIFF
    with rasterio.open(multiband_tiff_path) as src:
        print(src.profile)

        # Read the red and NIR bands
        red = (src.read(red_band_index)).astype('float32')
        nir = (src.read(nir_band_index)).astype('float32')

        ### rescale only data within range (1-65455) - 
        ### See https://www.usgs.gov/media/files/landsat-4-5-tm-collection-2-level-2-data-format-control-book
        red[(red > 0)&(red < 65456)] =  (red[(red > 0)&(red < 65456)] * 2.75e-5) + -0.2
        nir[(nir > 0)&(nir < 65456)] =  (nir[(nir > 0)&(nir < 65456)] * 2.75e-5) + -0.2

        # set negative reflectance values to 0 and saturated pixels to 1      
        red = np.clip(red, 0, 1)
        nir = np.clip(nir, 0, 1)

        # Calculate NDVI
        ndvi = (nir - red) / (nir + red)

        # ## Optional - plot out NDVI data
        # plt.imshow(ndvi)
        # plt.show()

        # Save the NDVI image
        profile = src.profile
        profile.update(dtype=rasterio.float32, count=1)

        # Construct the output path for NDVI image
        base_filename = os.path.splitext(os.path.basename(multiband_tiff_path))[0]
        ndvi_output_filename = f'{base_filename}_NDVI.tif'
        ndvi_output_path = os.path.join(output_folder, ndvi_output_filename)
        
        with rasterio.open(ndvi_output_path, 'w', **profile) as dst:
            dst.write(ndvi, 1)

    print(f'NDVI calculation complete. Output saved to {ndvi_output_path}')


# get all .tif (or .tiff) files in data folder
files = glob.glob('../data/*.tif') + glob.glob('../data/*.tiff')

# loop through and store all NDVI files in output folder
for file in files:
    calculate_ndvi_from_multiband_tiff(file, '../output', 3, 4)

Your problem was coming from the way that the reflectance values are scaled in the data you downloaded. Because there are values that represent missing (0) or saturated (65535) pixels, you need to ignore those when converting back to reflectance, let the 0 values remain at 0, and set the saturated pixels to 1.

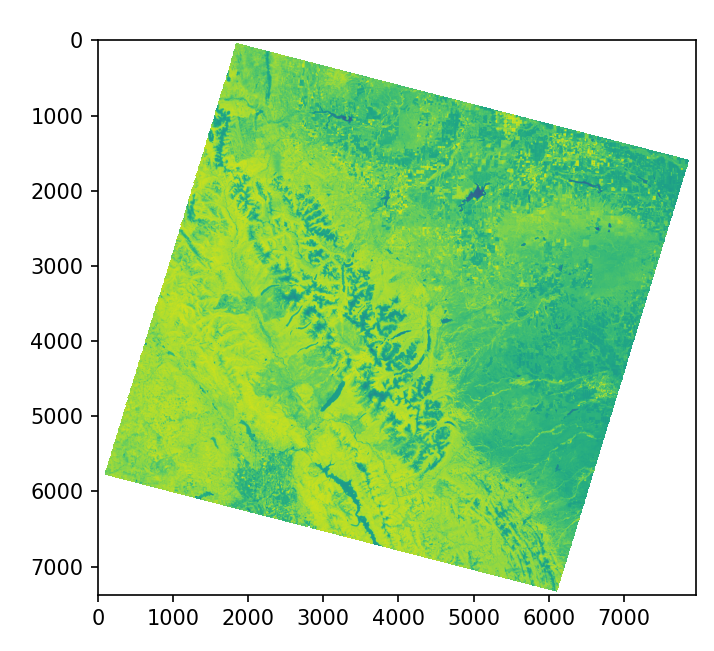
You can plot the NDVI layer from python using matplotlib by uncommenting the lines 32-33, they will now range from -1 to 1.

It looks like this for this example: enter image description here

See this table from here for reference Landsat5Table

3
  • Thank you. I have a few questions about the code it seems to be working? But just want to understand it a bit more. When we are doing np.clip() is that what is cutting out those extra values that appear to "fill" in my tile. And Perhaps you know a bit more about landsat, to calculate ndvi we need to apply scaling factors correct? LANDSAT/LT05/C02/T1_L2 is Surface reflectance in its 1 - 65455 form and we need to scale it back in order to perform calculations. Also I added in ` np.seterr(divide='ignore', invalid='ignore')` because I kept getting a division error, is this okay? Commented Jun 18 at 17:43
  • No problem, The np.clip() function is 'squeezing' the data to fit between 0 and 1. After we perform the rescaling, there are some datapoints with small negative values, so setting the min to 0 will force those negatives to 0. The only high values that should remain after the rescaling are the saturated pixels (65535), so setting the max to 1 will change those to reflectance = 1 = 100%. The scaling is done initially to convert from reflectance, which is a material property, to digital numbers (integers) which only serve to reduce the size of the data. You have to convert back to get true NDVI.
    – Kartograaf
    Commented Jun 18 at 21:23
  • The ignore errors line is fine, just will prevent those warnings showing up in the terminal. See the answer here for more about your scaling question. gis.stackexchange.com/questions/446640/…
    – Kartograaf
    Commented Jun 18 at 21:26

Your Answer

By clicking “Post Your Answer”, you agree to our terms of service and acknowledge you have read our privacy policy.

Not the answer you're looking for? Browse other questions tagged or ask your own question.