I am using QGIS 3 and I need to get reports from a selected feature of shapefile. This report has to include all the information of Attribute Table and if it is possible to show the selected polygon and the basemap that I use. I am using a shapefile which includes only polygons, and the records are more than 3000.
-
I suppose, you want a map, showing the single feature, and all of its attributes? Because "report" sounds more like "long text".– ErikCommented Jun 21 at 8:20
-
I want most a report, because I manage properties. So, when I select a polygon, which represents a property, I want to show me firstly the data of attribute table and if its possible a small map of a polygon– leo samsungCommented Jun 21 at 9:10
-
1Please provide an example of what you want to achieve. The term "report" is too ambiguous.– ErikCommented Jun 21 at 9:20
-
ok I made an image. Imagine this in A4 paper. ibb.co/h23kgcy– leo samsungCommented Jun 21 at 9:45
-
So... you want a map, showing a single feature, and some of its attributes. Have you read up on creating layouts and altas?– ErikCommented Jun 21 at 11:23
1 Answer
My solution does not include tools in QGIS but it can be applied via IDEs (Integrated Development Environments) or online Platforms (such as Jupyter Notebooks or Google Collab). I highly recommend the latter ones if you are not into programming.
The dataset I used is hybas_eu_lev03_v1c.shp and can be found here: https://www.hydrosheds.org/products/hydrobasins if you want to reproduce the results.
Code
# install the libraries
!pip install geopandas
!pip install python-docx

# import the libraries
import geopandas as gpd
import matplotlib.pyplot as plt
from docx import Document

data = gpd.read_file(r"F:\Tutorials\gis_exchange\hybas_eu_lev01-12_v1c\hybas_eu_lev03_v1c.shp")

# I will use the first 5 rows of the DataFrame data.
data_head = data.head(5)

# creation of images
for idx, row in data_head.iterrows():
    fig, ax = plt.subplots()
    # Plot the entire GeoDataFrame with a light color
    data.plot(ax=ax, color='lightgrey')
    # Highlight the individual feature
    data.iloc[[idx]].plot(ax=ax, color='red')
    # Customize the plot with title, labels, etc.
    ax.set_title(f'Feature {idx}')
    plt.savefig(str(row['HYBAS_ID'])+'.png')


data_cols = data_head.columns.to_list()

# creation of the report for each feature
for index, row in data_head.iterrows():
    document = Document()
    document.add_heading('Details', 0)
    p = document.add_paragraph('The details of the feature are presented below:')

    table = document.add_table(rows=1, cols=2)
    first_row = table.rows[0].cells
    first_row[0].text = 'Field'
    first_row[1].text = 'Value'
    table.style = 'Table Grid'

    # I removed teh last one since it was about geometryy and is not useful
    for i in range(len(data_cols) -1):
        row_cells = table.add_row().cells
        row_cells[0].text = str(data_cols[i])
        row_cells[1].text = str(row[data_cols[i]])

    print(str(row['HYBAS_ID'])+'.png')
    document.add_picture(str(row['HYBAS_ID'])+'.png')

    # export document
    output_file = f'passenger_{row["HYBAS_ID"]}.docx'
    print(output_file)
    document.save(output_file)
Explanation
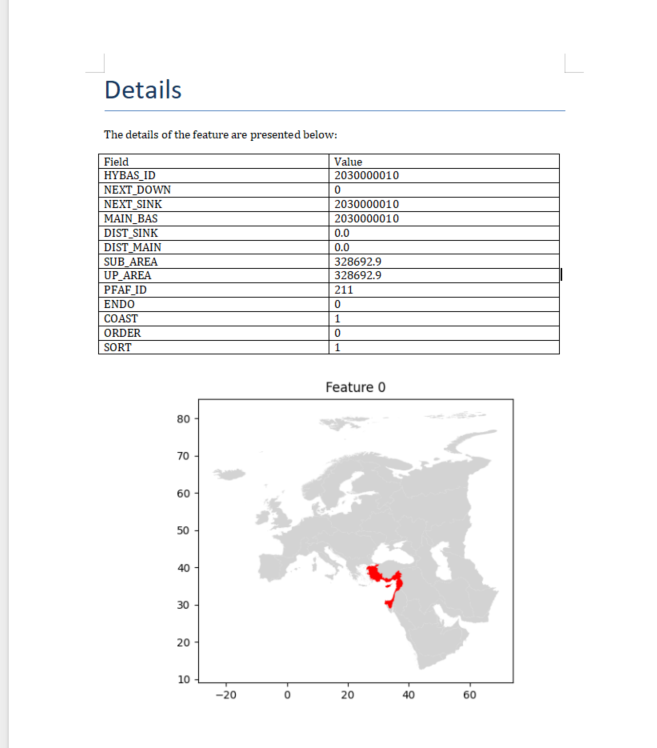
At the beginning, the code installs the necessary libraries, geopandas for spatial data manipulation and python-docx for creating Word documents. The script then reads a shapefile into a GeoDataFrame and extracts the first five rows to save time (in your case, will skip this row). For each of these rows, it generates a plot highlighting the specific feature against a backdrop of the entire dataset, saving each plot as a PNG file named after the feature's unique identifier.
Following this, the code prepares a Word document for each feature, which includes a heading, a paragraph, and a table listing all attribute fields except for the geometry. The relevant plot is also inserted into the document. Each document is then saved with a filename derived from the feature's unique identifier.
Outputs
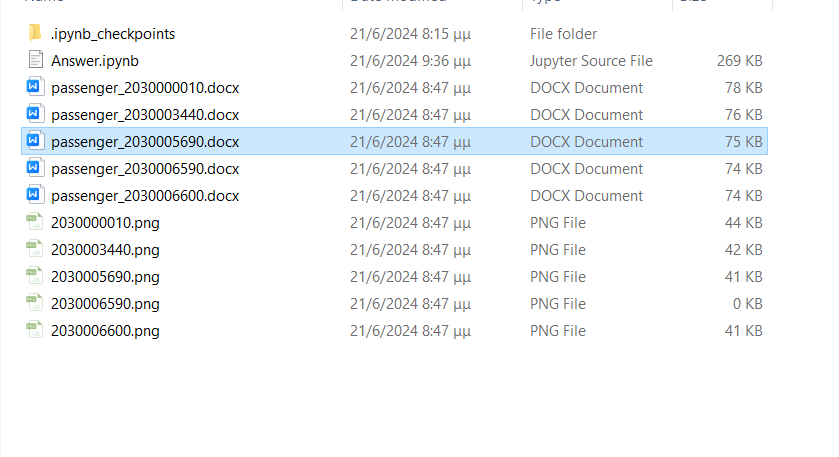
The provided code saves the output files in the same directory where the code is executed.
Last but not least, it is important to note that alternative solutions for similar tasks could be implemented using PyQGIS, a Python library for working with QGIS.


