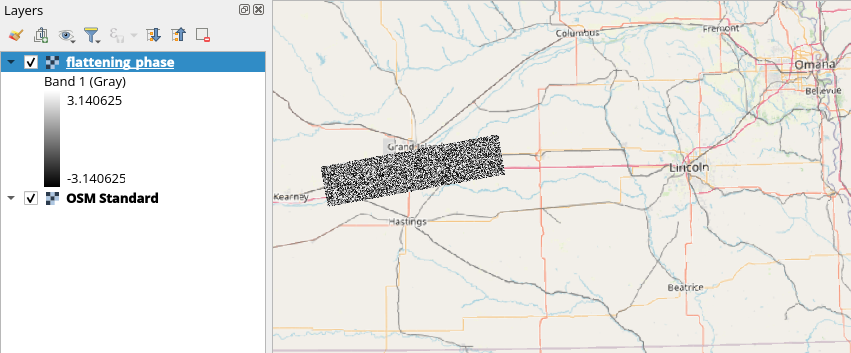
With the following hd5 file, how can I extract the flattening_phase layer and write it to a TIFF file with the correct CRS and affine/transform? Preferably using Python and/or GDAL.
1 Answer
GDAL doesn't understand the georeferencing information for the HDF5 dataset you link to. According to the docs for the GDAL HDF5 driver:
Georeference
There is no universal way of storing georeferencing in HDF files. However, some product types have mechanisms for saving georeferencing, and some of these are supported by GDAL. Currently supported are (subdataset_type shown in parenthesis):
- HDF5 OMI/Aura Ozone (O3) Total Column 1-Orbit L2 Swath 13x24km (Level-2 OMTO3)
- HDF-EOS5 grids (starting with GDAL 3.7)
- HDF-EOS5 swaths (starting with GDAL 3.7)
And your dataset is none of the above.
However, you can extract the relevant information from the HDF5 file using the h5py package. As GDAL can still read the data, you can then pass the georeferencing info to GDAL when converting to another format using gdal.Translate.
See the example below, noting the use of HDF5:file_name:subdataset syntax to specify the subdataset you want to convert.
import h5py
from osgeo import gdal

h5file = "OPERA_L2_CSLC-S1_T034-071121-IW2_20240711T003020Z_20240713T102356Z_S1A_VV_v1.1.h5"
h5subdataset = f'HDF5:"{h5file}"://data/flattening_phase'
output = "flattening_phase.tif"

f = h5py.File(h5file, 'r')
data = f["data"]

crs = int(data["projection"].attrs["epsg_code"])
xres = float(data["x_spacing"][()])  # scalar dataset, need to use [()] syntax
yres = float(data["y_spacing"][()])
xmin = float(data["x_coordinates"][0]) - xres/2  # x and y coords are for the centre of each pixel,
xmax = float(data["x_coordinates"][-1]) + xres/2 # so add/subtract 1/2 pixel size to get left/right or upper/lower coordinates
ymax = float(data["y_coordinates"][0]) - yres/2  # y_coords are reversed and yres is negative
ymin = float(data["y_coordinates"][-1]) + yres/2 # as map coords are bottom up and pixel indices are top down

gdal.Translate(
    output,
    h5subdataset,
    outputBounds=[xmin, ymax, xmax, ymin],
    outputSRS=f"EPSG:{crs}",
    noData="NaN",
    stats=True,
    creationOptions={"COMPRESS": "DEFLATE", "TILED": "YES"}
)

