5

I have a table with pairs of points. Out of that I want to create a line layer (that keeps all attributes of the table). One line for each raw from point to point. I want to calculate the length of these lines later.

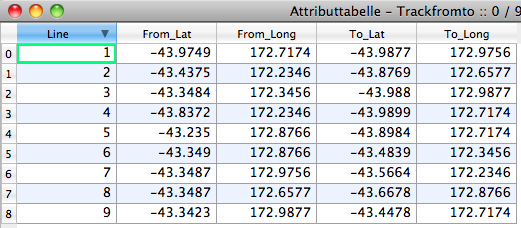
A simplified example table would look like that: table

Can I make this in QGIS?

I am using QGIS 1.8.0 on a Mac 10.6.8

4 Answers 4

6

I just did something similar. I ended up stringing the from/to columns together in WKT format, and saving the file as a .txt which I then imported with the delimited text tool in QGIS. Select the WKT field, and it will create the lines for you.

1
  • Wow!! Thats awesome. I had to learn a few things about WKT but know it works perfectly fine. Thanks heaps!
    – stefan
    Commented Mar 5, 2013 at 17:50
3

I don't know exactly if this is possible with QGis 1.8 and with a MAC, but here is how i would approach this problem.

  • Create two point layers (origin and destination). Pay attention that both layers have the same attribute (line). So in your case one point-layer with the first coordinate set (From_Lat and From_Long) and the other set.
  • Merge them. Now you should have one big point layer with your source and destination points.
  • Use QGis Points-To-Path plugin or the Sextante SAGA module "Convert Points to lines" to create lines out of your points. Seperate the lines with the attribute you specified in your "line" column.

Thats it. Its probably even easier to create the lines with a R script or with other tools.

1
  • Hey, thanks for your answer, but I tried the other approach first. Thanks anyway.
    – stefan
    Commented Mar 5, 2013 at 17:51
0

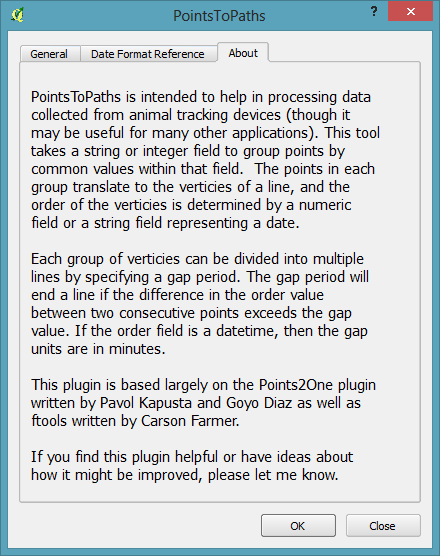
There is an updated tool / plugin now in QGIS called Points 2 Paths

enter image description here

0

You can do this in plain QGIS (without any plugin) with a little bit of math. Result shown below, for two point features (that is, two rows in the data set; hence there are 4 points): Link between two points defined in a single point record
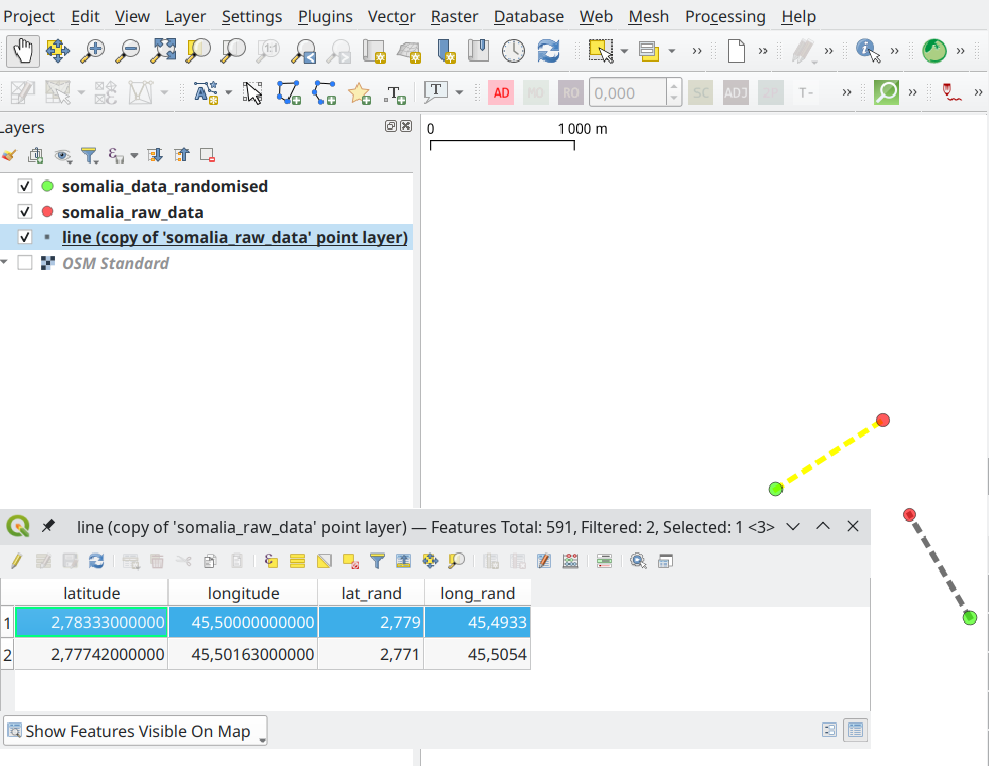
The trick is to use a special point (yes) symbol: the line, to scale it and rotate it.

In my case your From_Lat and From_Long fields are named latitude and longitude, while your 'to' coordinates become lat_rand and long_rand for me (you'll need to adjust the formulas below).

  1. Duplicate your point layer if you also want to display the points (this is also a way to check the lines are correctly placed).

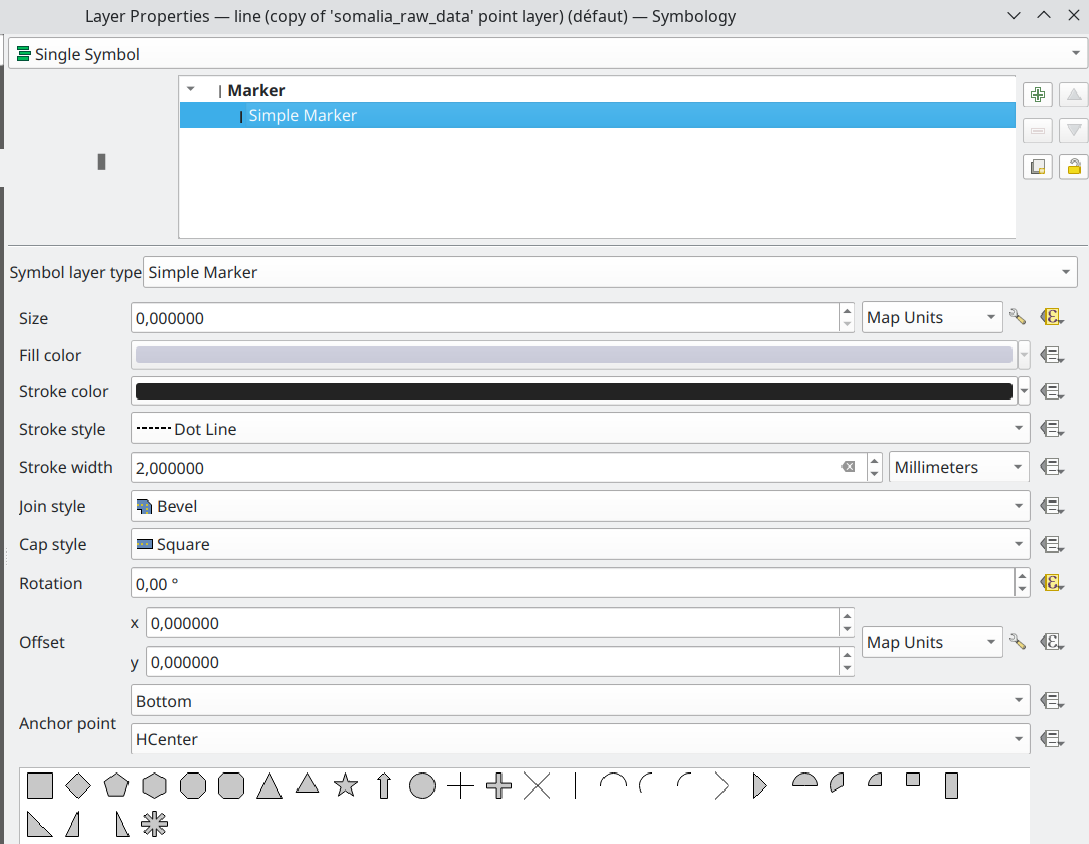
  2. Edit the symbology of the point layer, using the 'line' symbol (you could also use the 'arrow' symbol or the 'rectangle' symbol, or event the 'star' symbol or any symbol). Chose this in the Simple Marker properties, below "Anchor point".

  3. Set the size parameter, in the symbol parameters, as: sqrt( ("latitude"-"lat_rand" )^2 +("longitude" - "long_rand")^2 ) (note in my screenshot that the related icon became yellow). Make sure you select 'map units'.

  4. Set the rotation parameter as: 180+degrees (atan2("longitude" - "long_rand", "latitude"-"lat_rand")) (note in my screenshot that the related icon became yellow).

  5. Set "Anchor point" properties as "Bottom" and "HCenter" (horizontal center). Symbol parameters
  6. Click Apply to check on the map.

Your Answer

By clicking “Post Your Answer”, you agree to our terms of service and acknowledge you have read our privacy policy.

Not the answer you're looking for? Browse other questions tagged or ask your own question.