This is a custom, one-off file format, so don't expect the usual tools to read it correctly.
The documentation file describes the contents clearly and (for the most part) accurately. Logically, the file is organized into "gridboxes." Each grid box contains a table of information by year and month, along with summary information by year (precipitation in 0.1 mm) and summary information for the gridbox itself. Physically, each grid box is represented by a header line followed by one line for each year. The lines are in ASCII fixed format (produced by a Fortran program, evidently).
Although logically there are three tables here--gridboxes, years, and months--it might be simplest to "flatten" everything out as if all data had been joined, with one record per month. This could be added to any GIS as an "XY point event" layer, which can then be queried for any month and converted into raster format for further analysis (or kept as-is for statistical summaries).
The main task, then, is to do the reformatting. Python will perform this nicely, but I still prefer AWK for its quick development cycle and clarity, so here's my quick-and-dirty (yet tested) AWK solution. (The GNU AWK, GAWK, runs on Windows and other systems. It's freely available.) You can see that it just picks out all the fields within the two types of physical lines--"header" and "data"--and spits them back out, flattened (that is, showing all current values of all fields in every record) and tab-delimited. It preforms minimal error checking, presuming that the input has been correctly formatted and is uncorrupted. It is executed from a shell or command line like this:
awk -f [name of file.awk] [name of input file.dat] > [name of output file]
For instance, on my system I named this AWK file y.awk, extracted the zipped precipitation data file into F:/temp/, and my command was
awk -f y.awk f:\temp\g55wld0098.dat > y.txt
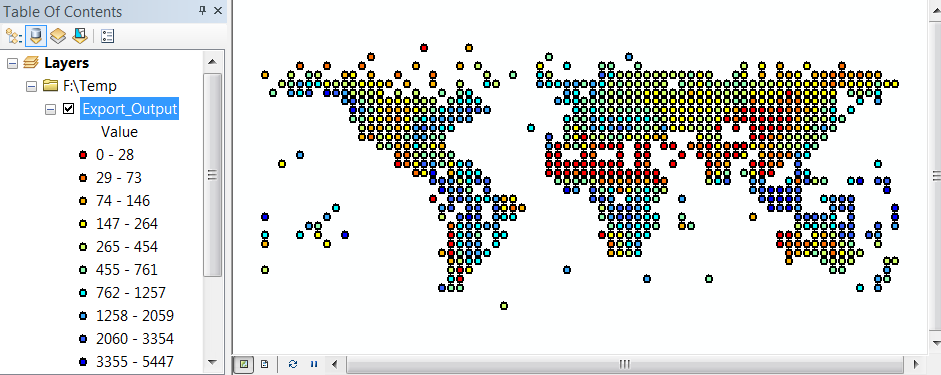
After symbolizing the XY event theme in ArcMap 10 by country name, selecting the data for December 1990 ("Year" = 1990 AND "Month" = 12), and converting that to shapefile format (for efficiency), it looked like this, all ready for analysis or conversion to raster format.

(Note that all values are in tenths of millimeters.)
Because trying to display or process all the data (around 10^5 records) brings my copy of ArcGIS 10 to its knees, it might slow down your GIS too. One solution is to filter the data you want during the AWK conversion so that your GIS has fewer records to deal with. Just modify the test for missing data to skip anything else you don't want in the output. (This is an order of magnitude faster than filtering the data in ArcGIS itself.) You could also modify this program to output the data directly in an ASCII raster format (as multiple files, one per month per year), but that would take a little more skill and might be unreliable, because there is no guarantee the input is physically ordered by gridbox.)
#
#    Global precipitation data (http://www.cru.uea.ac.uk/cru/data/precip/)
#
#    Header (I7,I5,I6,I5,A15,I4,A14,2I4,I7,I9):
#    388-6250 -4250    4ANTARCTICA        1  85% 85%  0% 19001998    388        1
#
#    Data (I4,12I5,I6):
#1900  -10  -10  -10  -10  -10  -10  -10  -10  -10  -10  -10  -10   -10
#
#   ("-10" is the null value.  It will be output unchanged.)
#
#    NB: the final data record may have some invisible non-numeric characters and
#        so is left unconverted; it is in 0.1 mm.
#----------------------------------------------------------------------------------#
BEGIN {
    nrecs = 0     # Number of records output
    maxerr = 20   # max error messages
    errcount = 0
    OFS = "\t"    # Output field separator
    #
    # Print a header line of field names.
    #
    print "Gridbox", "Lat", "Lon", "Altitude", "Country", "N", "Start", "End",
        "Diag1", "Diag2", "Precip", "Year", "Month", "Value"
}
length($0)!=70 && substr($0, 1, 7) == substr($0, 65, 7) { # Possible header
    gridbox = substr($0, 1, 7) + 0
    lat = substr($0, 8, 5)/100.0
    lon = substr($0, 13, 6)/100.0
    alt = substr($0, 19, 5) + 0
    country = "\"" substr($0, 24, 15) "\""
    n = substr($0, 39, 4) + 0
    diagnostic = substr($0, 43, 14)
    start = substr($0, 57, 4) + 0
    end = substr($0, 61, 4) + 0
    gridbox2 = substr($0, 65, 7) + 0
    diagnostic2 = substr($0, 72, 9)
    nrecs++
    printf("\rGrid box %-8d", nrecs) > "/dev/stderr"
    next
}
length($0)!=70 && errcount <= maxerr {
    print "Unable to interpret record " NR >> "/dev/stderr"
    errcount ++
    next
}
{   # Data record
    year = substr($0, 1, 4)
    precip = substr($0, 65) # (There are problems treating this value as numeric...)
    #
    # Print a data line for each month.
    #
    for (month = 1; month  <= 12; month ++) {
        value = substr($0, 5*month , 5) + 0 # In 0.1 mm
        if (value != -10) { # Skip missing values
            print gridbox, lat, lon, alt, country, n, start, end,
            diagnostic, diagnostic2, precip, year, month, value
        }
    }
}
END {
    print "\r" nrecs " gridbox records output." > "/dev/stderr"
    if (errcount > 0) print errcount " errors encountered." > "/dev/stderr"
}

