What is the best method to detect and graphically display the spatial trend of a variable? I'm looking for something that tells me the probability that the trend is from "north-west to south-east" or something like that. Someone wrongly (my opinion) suggested me to use kriging interpolation but I think that it is not correct to infer spatial trend by using estimated variables. I can use ArcGis or R. Thanks
-
Thanks @Geog. So you agree with me that kriging is not the correct way to asses this. I suppose you refer to trend surface analysis in your suggestion. Is there a way to get the most likely direction of variable's distribution? Am I wrongly talking about something different from what you referred to? And how to draw a map with this results? Thanks– e-falconCommented Jun 15, 2013 at 19:57
-
The main reason to remove a trend in geostatistics is to satisfy stationarity assumptions. Trends should only be removed if there is justification for doing so. Look for - "Looking for global trend" and "Modeling global trend" at ESRI website. It can be very helpful to check for trends in directions that vary from the standard N–S and E–W. To enable such a view, rotate the trend axes by scrolling the upper wheel on the right-hand side of the tool, just under the main display window.– Dror Har GilCommented Jun 16, 2013 at 6:27
4 Answers
 you can use Trend Anlysis.
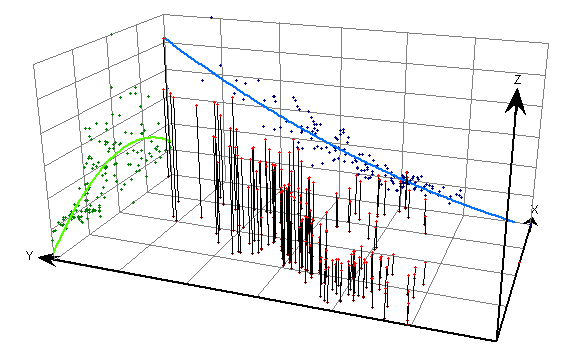
The Trend Analysis tool provides a three-dimensional perspective of the data. After locating the trend you need to decide whether to consider it and add "artificial masking" to the trend. Even if there is a moderate trend does not necessarily mean the application reduces or impairs the precision of interpolation.
Commonly, you model 1st order spatial trend using a low-order polynomial. The resulting surface is what you visualize to understand the 1st order (global) spatial trend in your data. You can model polynomial surfaces in ArcGIS or R.
You can extend this principle in a simple spatial regression by fitting a polynomial to [X,Y] and including this as a covariate in an OLS. This will act as a spatial lag in the regression. I do not necessarily recommend this but this was an early approach used in spatial statistics (see Statistical Inference for Spatial Processes by B.D. Ripley).
If you have a census of data, I do not believe there is a need to calculate the probability of a directional trend. My preference is to always use the most simple descriptive tools to analyze problems and scale up to more sophisticated analysis tools as needed. Consider using some very simple geographic distribution tools in ArcGIS.
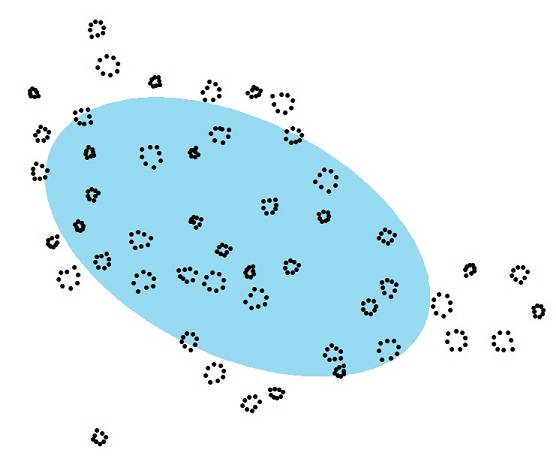
The attached image shows several points delineating forest gaps. If I am interested in learning the directionality of these disturbances in the forest, simply calculate the Standard Deviational Ellipse (shown as a blue polygon)(Figure 1). I specified 1 SD, although you may want to increase this to include more area. Now check the angle of this standard deviational elipse by opening the attribute table (Figure 2). This very simple analysis tells us that the trend is from NW to SE at 129 degrees.
Figure 1.

Figure 2.

-
This is a useful comment, but it refers to a very different sense of "trend" than the one implied in the question. Because the OP refers to kriging, they must have in mind the sense of a "trend" as a systematic variation in the value of a variable within a spatial extent, rather than the geometry of a point pattern.– whuberCommented Jul 17, 2013 at 20:20
-
1@whuber You're right, there's too little information to go on. If the OP edits the post to rule out point patterns trends, I will update this post– Aaron ♦Commented Jul 17, 2013 at 20:43
You could use Geographically weighted Regression (GWR) - there is an R package (spgwr) as well as other versions.
-
2This is a very bad suggestion. For one thing GWR is a very suspect method and second it is intended for modeling nonstationarity (2nd order or local spatial structure) and is dependent on covariates. This will not indicate the global 1st order trend in the data. Commented Jul 17, 2013 at 16:13
-
I checked with the authors "GWR can be used for first order methods. Although I think for what the original questioner was asking, probably a trivariate linear regression of z = a +bx +cy with p-values for b and c would do the trick. Occam's razor etc. And no GWR isn't suspect - but the responder's garbled explanation about second order effects and 'local' was :-)" Commented Jul 17, 2013 at 16:34
-
Because by its very nature GWR is intended to map out local variation, it is not an appropriate tool for the purpose of identifying and quantifying global trends. Yes, it can be adapted for the purpose (compute it at just one point and use a very long bandwidth), but that would be like using a shovel instead of a bulldozer to dig a foundation.– whuberCommented Jul 17, 2013 at 20:40
-
1Sorry to be contrary but there are significant issues that have been identified that effect GWR's reliability. The authors of GWR have neglected to addresses these issues. Give Paez et. al., (2011). www.envplan.com/abstract.cgi?id=a44111 a read. Commented Jul 18, 2013 at 16:46
