1

Let L be a set of line-segments (lines) in a two-dimensional (2D) Euclidean space that are randomly (say, using uniform random function) distributed, that is, some may overlap other(s). Overlapping could be on a point or a line segment (in this case it is partial or full overlapping). We aim to represent any frequency of overlapping lines in a reasonable way.

For those may think of rendering; it is not of our interest in this post.

To start, for example, our naive solution was to discretise all the lines into a grid, that is, aiming to generate a 2D raster map i.e., a matrix. In this way, we are able to count the number of visiting per cell for all lines in the set. The resulting map/matrix (as of our quick experiments) is promising.
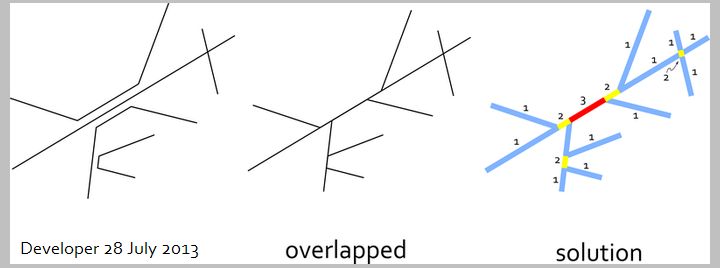
enter image description here

{1} What is the closest topic (if exists) to the aim of our question?
The answers may help us for improving our search keywords.
{2} Any thoughts on better ideas or suggestions for improvement?

2 Answers 2

1

We found a working solution as follows:

  1. Define P as set of endpoints of all lines
  2. Split all lines at the endpoints, P, producing L, set of newly generated lines
  3. Counts all line occurrences in L

The above has been implemented easily in Python and works just fine.

1
  • For those interested in Python implementation, easily use dict structure for removing duplicate points and latter for counting the occurrence of split lines (you also need an efficient algorithm to split lines on given points). :)
    – Developer
    Commented Aug 6, 2013 at 8:59
0

It may seem counter-intuitive at first but it sounds like you are describing, at least in part, line-on-line overlay for which ArcGIS has overlay events available within Linear Referencing.

4
  • We added a figure to demonstrate our aim. So the reality (left) is there are lines that overlap (middle) and we're looking to generate the one in the (right). Would you update your answer if you see that Linear Referencing may produce the (right)?
    – Developer
    Commented Jul 28, 2013 at 7:17
  • It won't be 5 mins work to give a comprehensive update to my answer so for now I will just say that your diagram matches what I was picturing and overlay events from linear referencing is definitely the approach I would investigate first for producing such a diagram. I think it can do the point resulting from the line crossing line too - that is the slight question mark for me.
    – PolyGeo
    Commented Jul 28, 2013 at 7:56
  • Sure. Meanwhile we have started evaluation of Linear Referencing for our target solution. BTW, it will be done in Python as we got how the algorithm works.
    – Developer
    Commented Jul 28, 2013 at 9:14
  • We found a simple and effective solution as posted.
    – Developer
    Commented Aug 5, 2013 at 10:09

Your Answer

By clicking “Post Your Answer”, you agree to our terms of service and acknowledge you have read our privacy policy.

Not the answer you're looking for? Browse other questions tagged or ask your own question.