12

Given multiple polygons that overlap in multiple ways, I would like to export from these features all polygons that don't overlap with others, iteratively.

The product would be a number of features with no overlap that, when summed together, make up the original.

The products could then be used as input to Zonal Statistics, and this would be much faster than iterating Zonal Statistics over each polygon.

I have been trying to code this in ArcPy without success.

Does code to do this already exist?

11
  • Do you mean you want to 'flatten' the data into a topologically correct set?
    – nagytech
    Commented Aug 26, 2012 at 13:10
  • @Geoist ZonalStats requires polygons that don't overlap. When you have an overlapping collection, the obvious but inefficient solution is to loop over the polys and compute zonal stats one by one. It would be more efficient to select a subset of non-overlapping polys, apply zonalstats to them, and iterate. The question asks how to make such selections efficiently.
    – whuber
    Commented Aug 26, 2012 at 21:05
  • whuber - I think that @Geoist is suggesting creating a set of non-overlapping polygons from the intersections of the input polygons. Look at this image - (can't post images in comments?). The input is on the left. The entire region is covered by three polygons, each of which intersects both of the others. The only non-overlapping subsets are the singletons and these do not satisfy Gotanuki's requirement that the union fills the space. I think Geoist is suggesting creating the set of non-intersecting regions on the right which is valid for zonalstats
    – Llaves
    Commented Aug 27, 2012 at 1:09
  • I think there is some confusion as to what the final product should be. Could you provide an example? My interpretation is you would like the output to be a selection of polygons that do not overlap--while discarding or dissolving the remaining polygons. Are you working with one or many feature classes?
    – Aaron
    Commented Aug 27, 2012 at 1:47
  • 1
    Sounds to me like @gotanuki is wanting to create the minimum number of feature classes which contain only non-overlapping polygons from a polygon feature class with overlapping polygons
    – PolyGeo
    Commented Aug 27, 2012 at 5:44

5 Answers 5

15

This is a graph coloring problem.

Recall that a graph coloring is an assignment of a color to the vertices of a graph in such a way that no two vertices which share an edge will also have the same color. Specifically, the (abstract) vertices of the graph are the polygons. Two vertices are connected with an (undirected) edge whenever they intersect (as polygons). If we take any solution to the problem--which is a sequence of (say k) disjoint collections of the polygons--and assign a unique color to each collection in the sequence, then we will have obtained a k-coloring of the graph. It is desirable to find a small k.

This problem is pretty hard and remains unsolved for arbitrary graphs. Consider an approximate solution that's simple to code. A sequential algorithm ought to do. The Welsh-Powell algorithm is a greedy solution based on a descending ordering of the vertices by degree. Translated to the language of the original polygons, first sort the polygons in descending order of the number of other polygons they overlap. Working in order, give the first polygon an initial color. In each successive step, try to color the next polygon with an existing color: that is, choose a color that is not already used by any of that polygon's neighbors. (There are many ways to choose among the available colors; try either the one that has been least used or else choose one randomly.) If the next polygon cannot be colored with an existing color, create a new color and color it with that.

Once you have achieved a coloring with a small number of colors, perform zonalstats color by color: by construction, you're guaranteed that no two polygons of a given color overlap.


Here's sample code in R. (Python code wouldn't be much different.) First, we describe overlaps among the seven polygons shown.
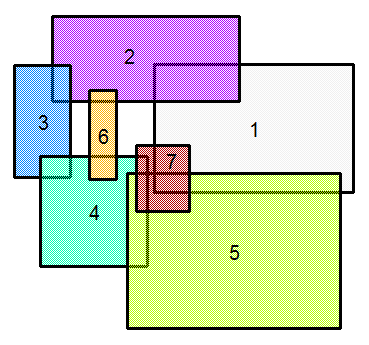
Map of seven polygons

edges <- matrix(c(1,2, 2,3, 3,4, 4,5, 5,1, 2,6, 4,6, 4,7, 5,7, 1,7), ncol=2, byrow=TRUE)

That is, polygons 1 and 2 overlap, and so do polygons 2 and 3, 3 and 4, ..., 1 and 7.

Sort the vertices by descending degree:

vertices <- unique(as.vector(edges))
neighbors <- function(i) union(edges[edges[, 1]==i,2], edges[edges[, 2]==i,1])
nbrhoods <- sapply(vertices, neighbors)
degrees <- sapply(nbrhoods, length)
v <- vertices[rev(order(degrees))]

A (crude) sequential coloring algorithm uses the earliest available color not already used by any overlapping polygon:

color <- function(i) {
  n <- neighbors(i)
  candidate <- min(setdiff(1:color.next, colors[n]))
  if (candidate==color.next) color.next <<- color.next+1
  colors[i] <<- candidate
}

Initialize the data structures (colors and color.next) and apply the algorithm:

colors <- rep(0, length(vertices))
color.next <- 1
temp <- sapply(v, color)

Split the polygons into groups according to color:

split(vertices, colors)

The output in this example uses four colors:

$`1`
[1] 2 4

$`2`
[1] 3 6 7

$`3`
[1] 5

$`4`
[1] 1
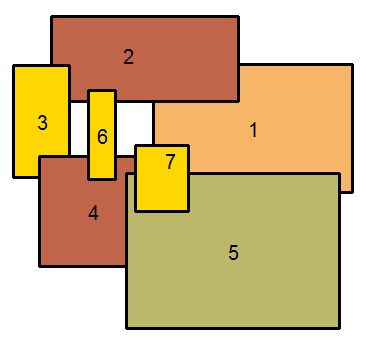
Four-coloring of the polygons

It has partitioned the polygons into four non-overlapping groups. In this case the solution is not optimal ({{3,6,5}, {2,4}, {1,7}} is a three-coloring for this graph). In general the solution it gets shouldn't be too bad, though.

2
  • I'm not sure if this answers the question, or what the question is, but it is a good answer none the less.
    – nagytech
    Commented Aug 28, 2012 at 2:01
  • @Geoist Is there some way I could make the illustration clearer or explain the problem better?
    – whuber
    Commented Aug 29, 2012 at 21:18
6

The methodology recommended by #whuber inspired me to take a new direction, and here is my arcpy solution, in two functions. The first, called countOverlaps, make two fields, "overlaps" and "ovlpCount" to record for each poly which polys overlapped with it, and how many overlaps occurred. The second function, explodeOverlaps, creates a third field, "expl", which gives a unique integer to each group of non-overlapping polys. The user can then export new fc's based on this field. The process is broken into two functions because I think the countOverlaps tool can prove useful by itself. Please excuse the sloppiness of the code (and the careless naming convention), as it's pretty preliminary, but it works. Also make sure that the "idName" field represents a field with unique IDs (only tested with integer IDs). Thank you whuber for providing me with the framework necessary to approach this problem!

def countOverlaps(fc,idName):
    intersect = arcpy.Intersect_analysis(fc,'intersect')
    findID = arcpy.FindIdentical_management(intersect,"explFindID","Shape")
    arcpy.MakeFeatureLayer_management(intersect,"intlyr")
    arcpy.AddJoin_management("intlyr",arcpy.Describe("intlyr").OIDfieldName,findID,"IN_FID","KEEP_ALL")
    segIDs = {}
    featseqName = "explFindID.FEAT_SEQ"
    idNewName = "intersect."+idName

    for row in arcpy.SearchCursor("intlyr"):
        idVal = row.getValue(idNewName)
        featseqVal = row.getValue(featseqName)
        segIDs[featseqVal] = []
    for row in arcpy.SearchCursor("intlyr"):
        idVal = row.getValue(idNewName)
        featseqVal = row.getValue(featseqName)
        segIDs[featseqVal].append(idVal)

    segIDs2 = {}
    for row in arcpy.SearchCursor("intlyr"):
        idVal = row.getValue(idNewName)
        segIDs2[idVal] = []

    for x,y in segIDs.iteritems():
        for segID in y:
            segIDs2[segID].extend([k for k in y if k != segID])

    for x,y in segIDs2.iteritems():
        segIDs2[x] = list(set(y))

    arcpy.RemoveJoin_management("intlyr",arcpy.Describe(findID).name)

    if 'overlaps' not in [k.name for k in arcpy.ListFields(fc)]:
        arcpy.AddField_management(fc,'overlaps',"TEXT")
    if 'ovlpCount' not in [k.name for k in arcpy.ListFields(fc)]:
        arcpy.AddField_management(fc,'ovlpCount',"SHORT")

    urows = arcpy.UpdateCursor(fc)
    for urow in urows:
        idVal = urow.getValue(idName)
        if segIDs2.get(idVal):
            urow.overlaps = str(segIDs2[idVal]).strip('[]')
            urow.ovlpCount = len(segIDs2[idVal])
        urows.updateRow(urow)

def explodeOverlaps(fc,idName):

    countOverlaps(fc,idName)

    arcpy.AddField_management(fc,'expl',"SHORT")

    urows = arcpy.UpdateCursor(fc,'"overlaps" IS NULL')
    for urow in urows:
        urow.expl = 1
        urows.updateRow(urow)

    i=1
    lyr = arcpy.MakeFeatureLayer_management(fc)
    while int(arcpy.GetCount_management(arcpy.SelectLayerByAttribute_management(lyr,"NEW_SELECTION",'"expl" IS NULL')).getOutput(0)) > 0:
        ovList=[]
        urows = arcpy.UpdateCursor(fc,'"expl" IS NULL','','','ovlpCount D')
        for urow in urows:
            ovVal = urow.overlaps
            idVal = urow.getValue(idName)
            intList = ovVal.replace(' ','').split(',')
            for x in intList:
                intList[intList.index(x)] = int(x)
            if idVal not in ovList:
                urow.expl = i
            urows.updateRow(urow)
            ovList.extend(intList)
        i+=1
1
  • 2
    To connect this to my solution: your countOverlaps corresponds to the two lines nbrhoods <- sapply(vertices, neighbors); degrees <- sapply(nbrhoods, length) in my code: degrees is the overlap count. Of course your code is lengthier because it reflects most of the GIS analysis that is taken for granted in my solution: namely, that you first identify which polygons overlap, and that at the end you use the solution to output polygon datasets. It would be a good idea to encapsulate the graph-theoretic calculations, so if you ever find a better coloring algorithm, it would be easy to plug in.
    – whuber
    Commented Aug 28, 2012 at 16:03
2

It's been awhile, but I used this code for my own application and it's been working great — thank you. I re-wrote part of it to update it, apply it to lines (with a tolerance) and speed it up significantly (below — I'm running it on 50 million intersecting buffers and it only takes a couple of hours).

def ExplodeOverlappingLines(fc, tolerance, keep=True):
        print('Buffering lines...')
        idName = "ORIG_FID"
        fcbuf = arcpy.Buffer_analysis(fc, fc+'buf', tolerance, line_side='FULL', line_end_type='FLAT')
        print('Intersecting buffers...')
        intersect = arcpy.Intersect_analysis(fcbuf,'intersect')

        print('Creating dictionary of overlaps...')
        #Find identical shapes and put them together in a dictionary, unique shapes will only have one value
        segIDs = defaultdict(list)
        with arcpy.da.SearchCursor(intersect, ['Shape@WKT', idName]) as cursor:
            x=0
            for row in cursor:
                if x%100000 == 0:
                    print('Processed {} records for duplicate shapes...'.format(x))
                segIDs[row[0]].append(row[1])
                x+=1

        #Build dictionary of all buffers overlapping each buffer
        segIDs2 = defaultdict(list)
        for v in segIDs.values():
            for segID in v:
                segIDs2[segID].extend([k for k in v if k != segID and k not in segIDs2[segID]])

        print('Assigning lines to non-overlapping sets...')
        grpdict = {}
        # Mark all non-overlapping one to group 1
        for row in arcpy.da.SearchCursor(fcbuf, [idName]):
            if row[0] in segIDs2:
                grpdict[row[0]] = None
            else:
                grpdict[row[0]] = 1

        segIDs2sort = sorted(segIDs2.items(), key=lambda x: (len(x[1]), x[0])) #Sort dictionary by number of overlapping features then by keys
        i = 2
        while None in grpdict.values(): #As long as there remain features not assigned to a group
            print(i)
            ovset = set()  # list of all features overlapping features within current group
            s_update = ovset.update
            for rec in segIDs2sort:
                if grpdict[rec[0]] is None: #If feature has not been assigned a group
                    if rec[0] not in ovset: #If does not overlap with a feature in that group
                        grpdict[rec[0]] = i  # Assign current group to feature
                        s_update(rec[1])  # Add all overlapping feature to ovList
            i += 1 #Iterate to the next group

        print('Writing out results to "expl" field in...'.format(fc))
        arcpy.AddField_management(fc, 'expl', "SHORT")
        with arcpy.da.UpdateCursor(fc,
                                   [arcpy.Describe(fc).OIDfieldName, 'expl']) as cursor:
            for row in cursor:
                if row[0] in grpdict:
                    row[1] = grpdict[row[0]]
                    cursor.updateRow(row)

        if keep == False:
            print('Deleting intermediate outputs...')
            for fc in ['intersect', "explFindID"]:
                arcpy.Delete_management(fc)
1

This post helped me solve my problem, so I figured I'd post my solution. It's similar to the highlighted answer, but removes a couple superfluous loops and utilizes the ArcPy Data Access cursors for faster processing. I also added more in-code documentation.

def separate_overlaps(in_fc, id_field, workspace):
    """
    If input polygon feature class contains overlapping polygons, return a list 
    containing lists of feature IDs that do
    not overlap. If no overlaps exist, return False.
    :param in_fc: Input polygon feature class to be assessed.
    :param id_field: ID field to be used in output groupings.
    :param workspace: Workspace to be used. Can be a local location, or "in_memory".
    :return: A list of lists, each containing only IDs of features that do not overlap 
    each other.
    """
    # Intersect to find overlaps
    int_fc = os.path.join(workspace, "int_fc")
    arcpy.Intersect_analysis(in_fc, int_fc)
    oid_field = arcpy.Describe(int_fc).OIDFieldName
    if int(arcpy.GetCount_management(int_fc).getOutput(0)) > 0:

        # Find identical features
        ident_table = os.path.join(workspace, "ident_table")
        arcpy.FindIdentical_management(int_fc, ident_table, "Shape")

        # Join ID field
        arcpy.JoinField_management(ident_table, "IN_FID", int_fc, oid_field, id_field)

        # Create dictionary of overlaps by FEAT_SEQ value
        seq_dict = {}
        with arcpy.da.SearchCursor(ident_table, ["FEAT_SEQ", id_field]) as s_cur:
            for row in s_cur:
                if row[0] not in seq_dict.keys():
                    seq_dict[row[0]] = [row[1]]
                else:
                    seq_dict[row[0]].append(row[1])

        # Create a dictionary of overlaps by ID
        ovl_dict = {}
        overlaps_list = seq_dict.values()
        with arcpy.da.SearchCursor(ident_table, [id_field]) as s_cur:
            for row in s_cur:
                val = row[0]
                overlaps = []
                for ovls in overlaps_list:
                    if val in ovls:
                        ovls_add = [x for x in ovls if x != val and x not in overlaps]
                        overlaps.extend(ovls_add)
                ovl_dict[val] = overlaps

        # create a list containing lists of features that do not overlap each other
        non_ovl_list = [[]]
        with arcpy.da.SearchCursor(in_fc, [id_field]) as s_cur:
            for row in s_cur:
                # Check if ID has overlaps. If not, add to the first group.
                if row[0] not in ovl_dict.keys():
                    non_ovl_list[0].append(row[0])
                else:
                    # Check each group in non_ovl_list to see if it contains overlaps for this ID.
                    # If no overlaps exist, add ID to group.
                    # If all groups contain overlaps, add a new group to the list.
                    ref = 1
                    for item in non_ovl_list:
                        overlaps = ovl_dict[row[0]]
                        result = any(elem in overlaps for elem in item)
                        if result:
                            if ref == len(non_ovl_list):
                                non_ovl_list.append([row[0]])
                                break
                            else:
                                ref += 1
                        else:
                            item.append(row[0])
                            break
        return non_ovl_list
    else:
        return False
-3

In this cases I generally use the following method:

  • Pass the Feature class through a UNION; (It breakes the polygons in all its intersections)
  • Add X, Y and Area fields and calculate them;
  • Dissolve the result by X, Y, Area fields.

I believe the result will be the one you wanted, and you can even count the number of overlaps. Don't know if in terms of performance will it be better for you or not.

4
  • 2
    this method doesn't get you to the desired product, which is a minimal series of selections or unique feature classes of the original that do not overlap. the products will be fed into zonal statistics, and therefore keeping the original geometry of each feature is vital. Commented Aug 29, 2012 at 17:32
  • You are right, sorry. I did not understood the question well. In that case, and depending on the size of the raster, I would normally convert the raster to a temporary point feature class (each cell a point), and perform a spatial join between it and the polygon layer. Maybe its a very simplistic, and performance unfriendly approach but works and the overlapped polygons won't give you any problem. Commented Aug 29, 2012 at 17:58
  • If I understand correctly what you mean by this spatial join, your second solution still won't work, Alexandre, because there is a many-to-many relation between the points and the polygons. Regardless, for any sizable raster this vector-based approach will be extremely inefficient and for large rasters it will be impossible to carry out.
    – whuber
    Commented Aug 29, 2012 at 21:16
  • @whuber You are right about being a very slow process (Toke me around half-hour with a 4284 x 3009 raster and 2401 polygons, in a dualcore 2.8Ghz, 3Gb RAM with vista). But It works, as I have tested it already. In the Spatial Join you have to use one to one relation, and aggregate the raster values (as mean, Sum, etc...). The result will be a vector polygon layer similar to the original but with a new column with the aggregated raster values that intersect each polygon. Not being a optimal solution this could be useful for someone with less programming skills (like me :-)). Commented Aug 30, 2012 at 11:23

Your Answer

By clicking “Post Your Answer”, you agree to our terms of service and acknowledge you have read our privacy policy.

Not the answer you're looking for? Browse other questions tagged or ask your own question.