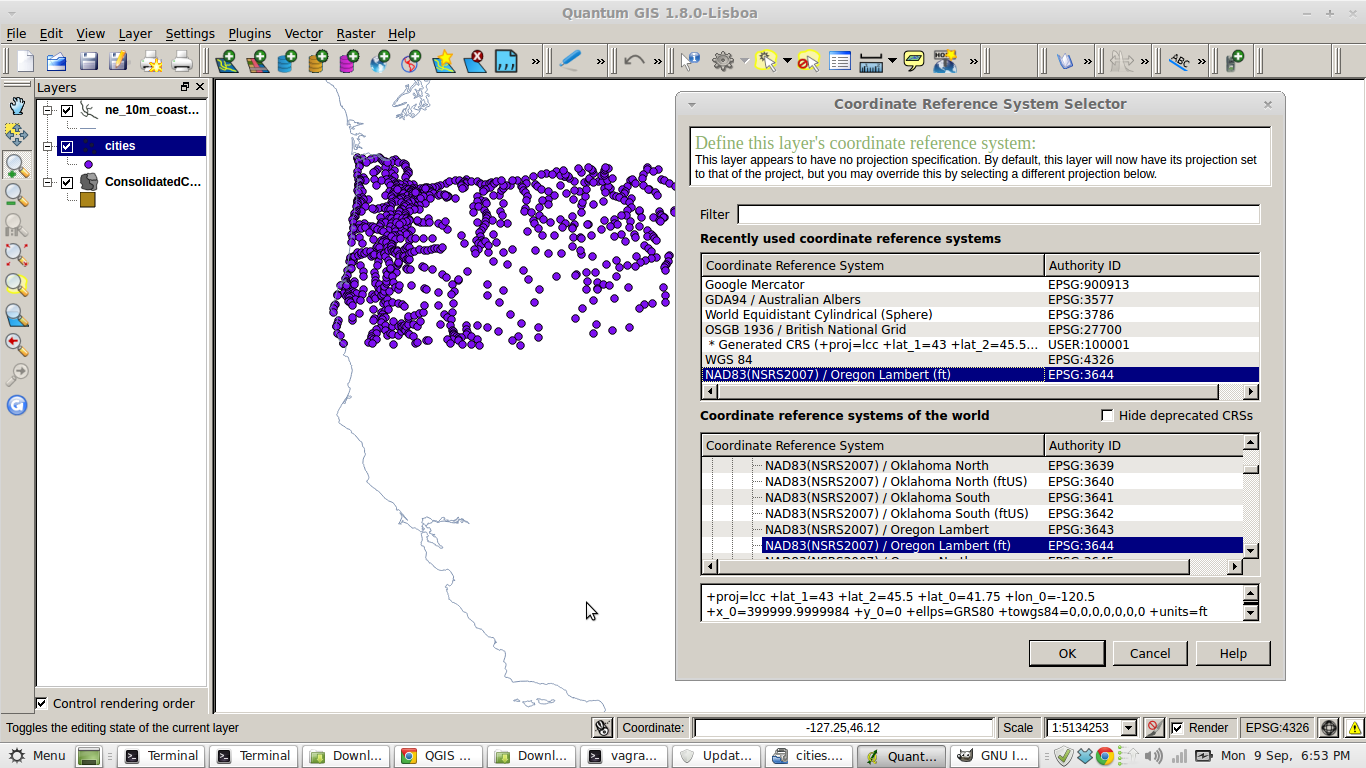
I have the Census TIGER data for Oregon from
http://www.census.gov/geo/maps-data/data/tiger-data.html
Then the bottom one of 2010 Census Population & Housing Unit Counts — Blocks.
The shapefile loads fine into QGIS 1.8 and shows it as EPSG 4269/NAD83.
Then I have this city data from the State of Oregon Website.
http://navigator.state.or.us/sdl/data/shapefile/m2/cities.zip
It claims to be in EPSG 4269/NAD83 also.
When I first loaded it up the scale of both were WAY off. The projection of the Cities you had to zoom out so far to see that the state population map became a tiny dot. (i.imgur.com/QZLQjfO.jpg) I re-saved the cities shapefile and chose to save it as a EPSG 4269/NAD83 and reloaded it. Now they both show on the same scale but the cities is far south of the Tiger file. (i.imgur.com/wI1OzSG.jpg) I tried enabling on the fly projections to see if that would fix it and no go. I manually loaded up some geocoded addresses under the NAD83 and they fit perfectly onto the TIGER/Census map so I think there is something wacky with the city data but I can't figure it out.
I am pretty new to QGIS and very much a novice at GIS in general. Any tips or ideas on ways to get these to line up would be helpful.
I have found that if I save other files to 3644 they match up with the Cities data. But if I save the cities data as any style let it be 3644 or 4269 it no longer matches up it becomes like Image 2 where it is way south of the other files. This leads me to think that the Cities file has some sort of lat/long correction that when saving to other CRS or when re-projecting as other CRS causes it to show up very far south. Now investigating how to remove/fix this attribute any and all help is appreciated.

