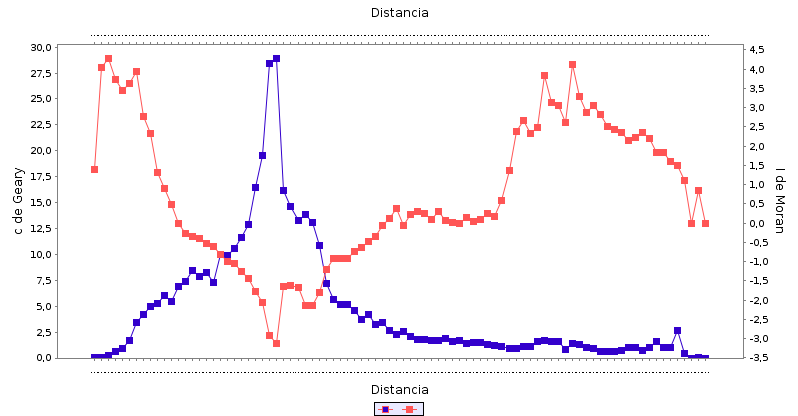
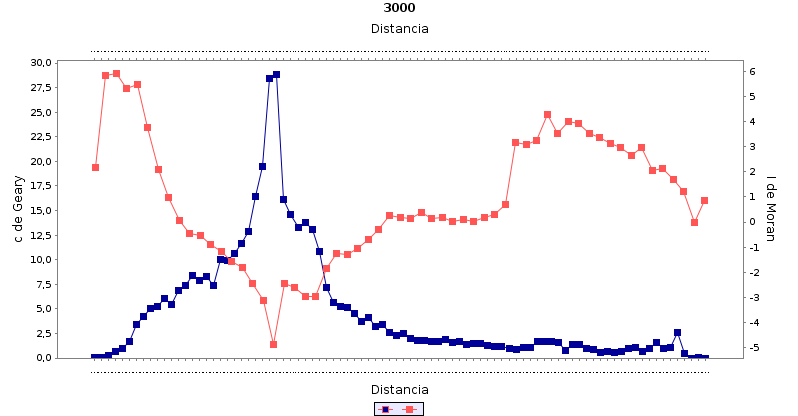
Hello Moran's I and Geary's C are in fact inversely related to one another. So the general pattern that you're observing seems consistent. However, the possible range of values for Moran's I is -1 to 1 (where -1 indicates a perfect negatively spatial autocorrelation--think of a chess board pattern--and 1 indicates a perfect positive spatial autocorrelation). You're values fall well outside this range. Unless you've applied a multiplier, I think something may be wrong. As for Geary's C, it ranges from 0 to 2 where 1 is no spatial autocorrelation (values vary through space independent of one another or randomly). C values near 0 are positively spatially correlated while those near 2 are highly negatively autocorrelated. Again your plots indicate that the C values fall well outside this range which makes me suspicious of their validity unless a multiplier has been applied. While I and C are inversely related, the relation is not perfect. Of course if one were a perfect inverse of the other, there wouldn't be a need for both indices!
To interpret the data, it appears that at short distances, values exhibit a strong positive association (i.e. when one value is high, a nearby value is also high--as per Tobler's first law of Geography). Then at moderate distances (sorry I can't read your distance values off the plots) the association between points through space becomes negatively correlated, i.e. when one is high the other distant point is likely to be low. Eventually, at slightly longer distances the autocorrelation drops to the point of random association (Moran's I near 0) until it again moves to ranges where there is a moderately strong positive association among points before dropping to a random association at the greatest distances.
As for the question of what technique you should use to describe the pattern of spatial autocorrelation at varying distances, you've effectively created a correlogram here, but most people would use a variogram model to describe this pattern. They are more or less interchangeable though. The reason that the variogram is more popular is because it is used for kriging.


