31

This is not the first time I've stumbled over this issue; it seems that I am unable to generate a correct drainage network model and the resulting catchments from full resolution (1m cells) LiDAR data.

When I generalize the LiDAR dataset, convert it to an integer DEM and fill sinks, all is good and I can easily create what appears to be a very generalized model. However, I would like to produce a detailed site model for a large scale map and this is where I am having problems.

I should point out that most issues occur in flatter areas.

I would like the drainage network to accurately follow the terrain but when I use create the drainage network from an integer DEM input the resulting streams are very general and often "disconnected" in areas where it should not be. The streams are do not even closely follow the natural ridges in the terrain. There are also a lot of "orphan" or "go nowhere" segments. When I use a floating point DEM input, the resulting drainage network is detailed and accurate but very disconnected, clustered and "littered" with orphan streams.

I suspect my problem lies somewhere in the data preparation; integer vs floating point raster DEM input, filling sinks correctly, etc. Or could it be that I have to process the surface data somehow to first create a "hydrologically correct" input DEM?

Can someone describe the correct methodology for creating continuous drainage networks and catchments using high resolution LiDAR?

As it stands I have more success with creating the model from an integer DEM input. This however is not ideal for detailed large scale analysis:

The first attached image is a model produced from an integer DEM input. Several obvious problem areas are circled. Please note that there is actually a stream in what appears to be the main drainage channel. I added a very generalized version of the stream. enter image description here
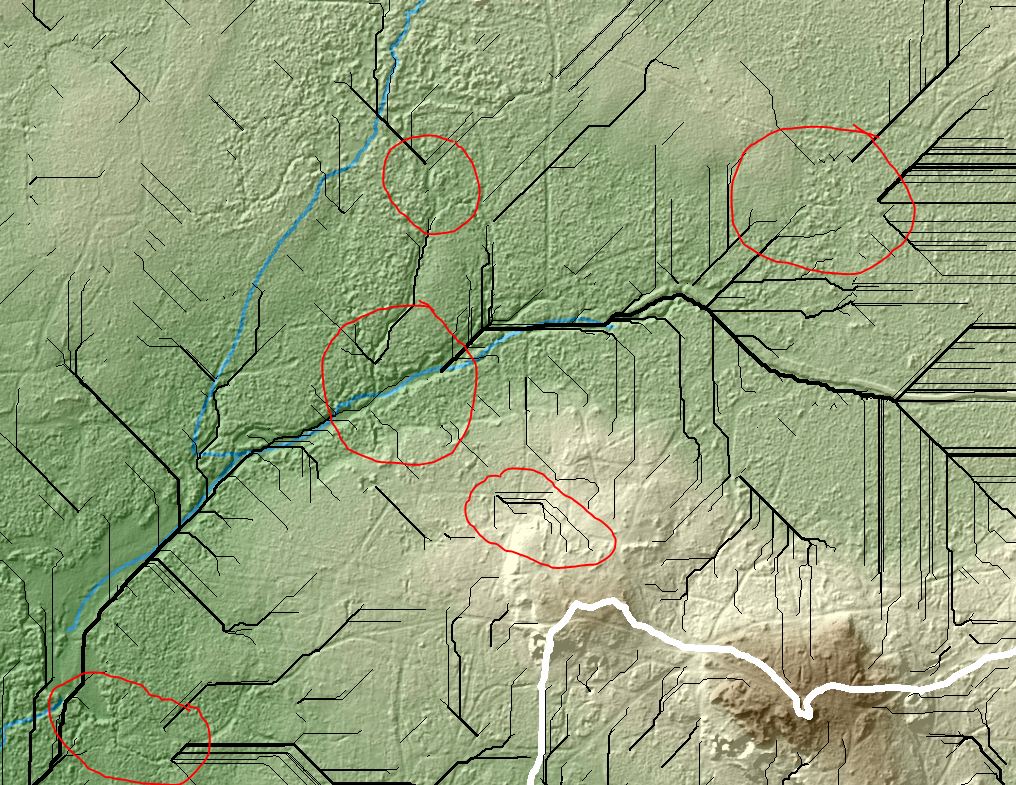
EDIT: As I already mentioned I have more success with creating the model from an integer DEM input. The following screen captures illustrate why that is. Even though the integer DEM input has many problems as can be seen above it still produces a drainage network that is less disconnected albeit not conforming to the terrain characteristics. As you can see on the image directly below using a floating point DEM input produces a very disconnected and clustered network full of small orphan segments.

Flow Accumulation raster produced from a floating point DEM enter image description here
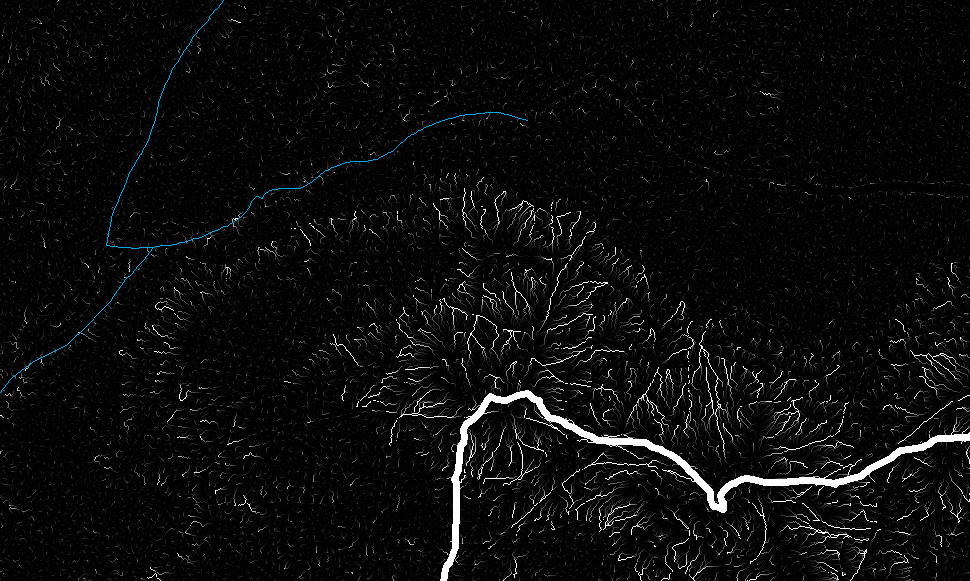
Flow Accumulation raster produced from an integer DEM enter image description here
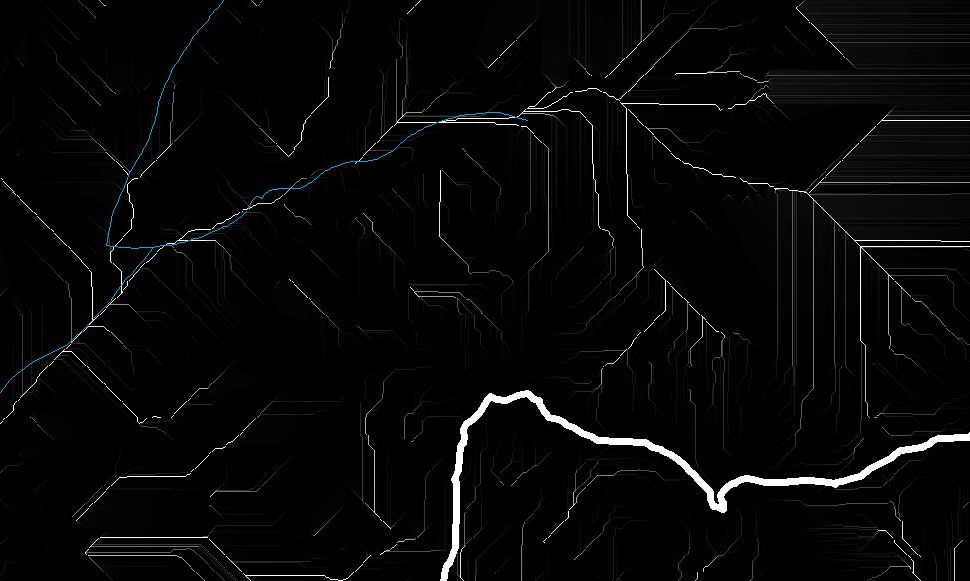
As far as i can deduct, both methods yield dramatically different results, both methods are unusable for a detailed model.

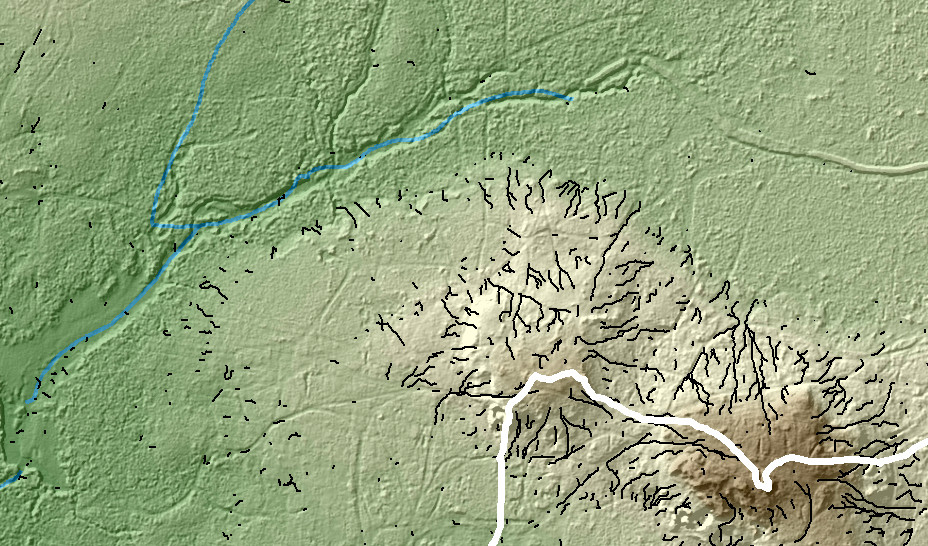
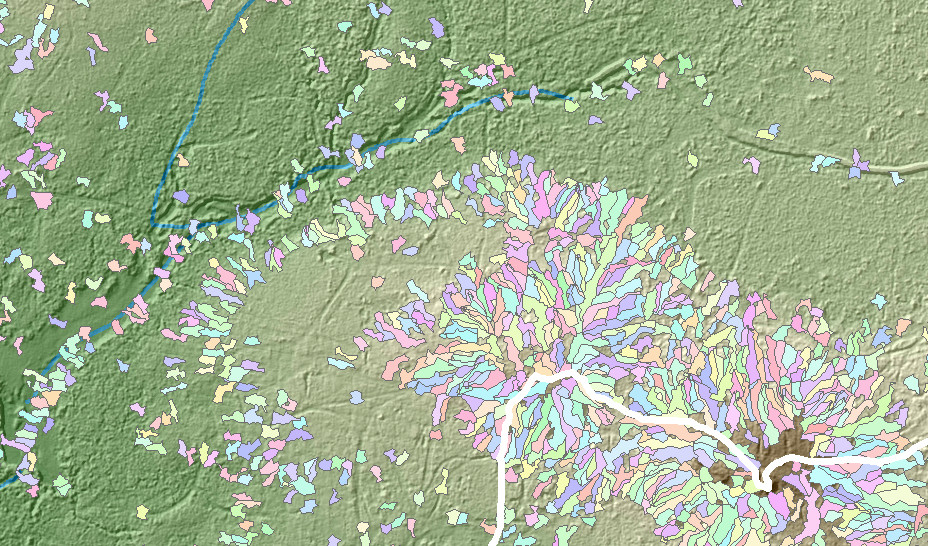
EDIT: I apologize for making this post longer and longer (perhaps I am not expressing myself clearly in English) To further illustrate the problem with using a floating point DEM for input I am attaching the resulting Stream Link output as well as the resulting watersheds. What I am expecting is a continuous Stream Network and a the entire area covered in basins that all flow into each other.

Stream Link produced from a floating point input DEM: enter image description here
Watershed basins produced from a floating point input DEM: enter image description here
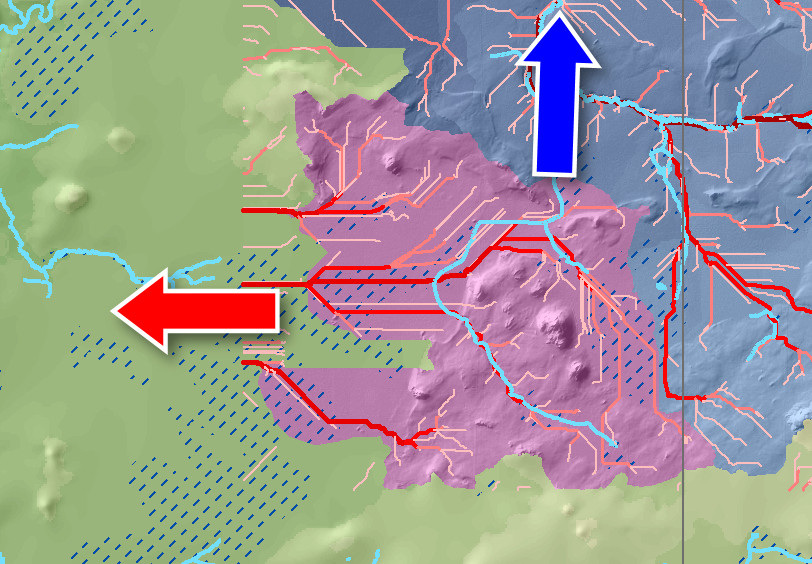
Here is an example (nearby area, same data) of where the entire flow direction of a basin is changed due to the use of integer DEM input: Red arrow is the flow direction of the model and blue arrow indicates the direction of the actual flow. (blue lines - actual streams, red network is the LiDAR derived stream network Strahler order) enter image description here
Link to data: https://www.yousendit.com/download/MEtSOGNVNXZvQnRFQlE9PQ (Will expire May 13, 2011)

22
  • 2
    See also related question: Workflow for determining stream gradient? Commented May 3, 2011 at 15:02
  • Where does the hillshading come from? The (black) flow accumulation results do not seem to be derived from the hillshaded elevations. Perhaps you could show us the same map but with a hillshaded rendition of the grid used to obtain the flow accumulation values.
    – whuber
    Commented May 3, 2011 at 16:06
  • Right. I should have mentioned that. The hillshade is derived from the same grid. (And the black stream network is a Stream order (Strahler) derived from the Stream Link raster) Everything on this map except for the location of the stream (blue) is generated from the same grid. Commented May 3, 2011 at 16:16
  • 2
    my advice for narrowing down complex problems is to use a simple test case. Clip a small piece of from your raw raster source, and try the steps the way you'd like (e.g., keep as float). Definitely fill sinks, always. Carefully examine the output of each step to make sure it "looks right".
    – Mike T
    Commented May 4, 2011 at 19:21
  • 2
    Jakub I get the same exact problems. You aren't alone! The answer I'd been given previously was not to use the LiDAR data for creating drainage networks... Commented May 4, 2011 at 21:35

7 Answers 7

13

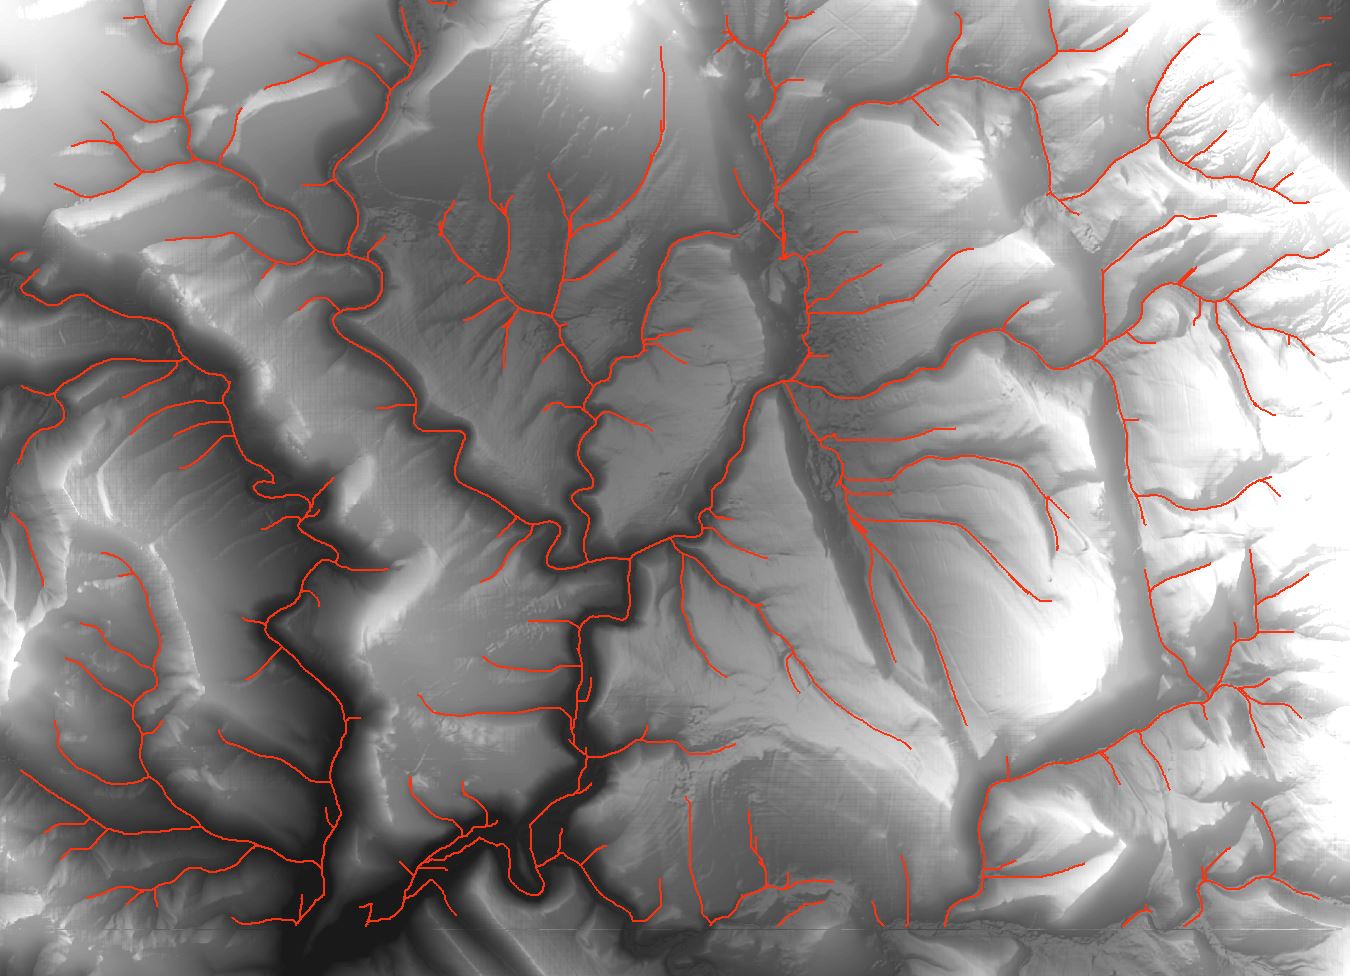
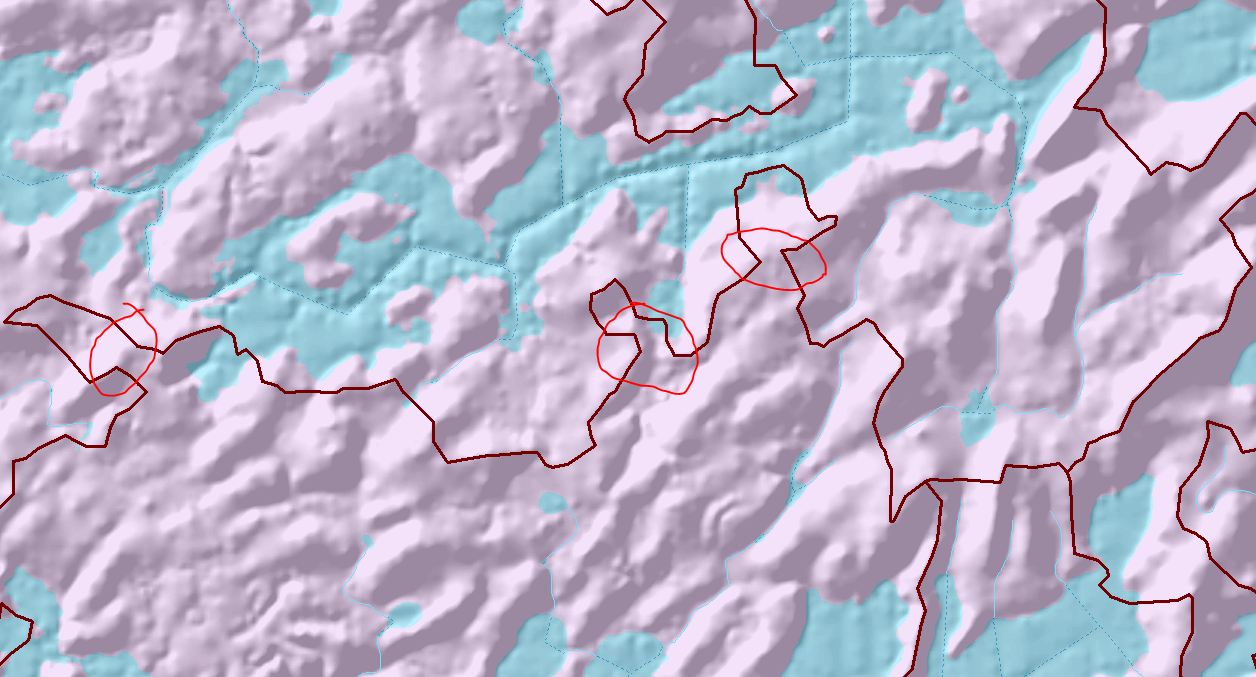
Have you consider to use GRASS GIS analysis? I have expirience that GRASS algorithms have very good accurance on hydrology analysis. For example, I want to generate something like drainage network on DTM with resolution 5x5m. I had compared tools from ArcMap (including ArcHydro Tools) and you can view the result on first picture (red lines). Then I tried to use GRASS GIS function 'r.stream.extract' and I had got result shown on picture 2 (red lines). Both drainage lines are generated with cathement area 3 hectares.

It is really different, and it has pretty accurance in comparsion with real streams (picture 3, real streams are blue). And GRASS GIS has many hydrological tools, i.e. for generate catchement area too.

Drainage lines using ArcMap] Drainage lines using GRASS GIS Comparsion between GRASS GIS drainage lines and real streams

4
  • 1
    Very Interesting! You are able to produce the same error I am seeing using ESRI tools. This leads me to believe that the ESRI algorithm is simply not capable to deal with high resolution data. This pretty much answers the question. Thanks for the visuals - amazing! I have next to no experience using GRASS tools for watershed/drainage analysis. I would greatly appreciate if you could point me to a basic "how-to" tutorial. Commented Dec 18, 2015 at 21:02
  • 1
    Just wanted to say that this is great! Running some preliminary tests with a colleague of mine on our Lidar datasets and early results are looking very promising. Amount of features and parameters and the ability to even add some cartographic touches is great. Results are matching up with actual streams. Also finding out just how outdated the ESRI algorithms are - unchanged since the mid 80s. That explains a lot. Thank You! Commented Dec 19, 2015 at 15:00
  • I'm glad that I helped you! I like GRASS GIS for lots of hydrological analysis and for very good results that it gives. Like you said, ESRI is really outdated. I don't even know hom much outdated it is. If you want to try more hydrological analysis, check out this pages (maybe you allready have): grasswiki.osgeo.org/wiki/Hydrological_Sciences and grass.osgeo.org/grass70/manuals/topic_hydrology.html.
    – david_p
    Commented Dec 21, 2015 at 13:38
  • GRASS GIS has only one disadvantage I think, and it is the special native environment for layers. It's a bit annoying for those who dont know GRASS as well. But after while, you shnoud use to it.
    – david_p
    Commented Dec 21, 2015 at 13:42
8
+75

With regard to generating hydrologicaly correct elevation models, also called drainage enforced, ANUDEM, remains best of breed to my knowledge. It's the program used to generate the Canadian national elevation dataset (CDED, ironically stored as integer-metres). Also the TopoToRaster tool in ArcGIS uses Anudem under the hood (a revision or three behind current).

The USGS used a different program for the United States model, Delta3D by AverStar, but when I enquired (ten years ago) it was a custom program and not available off the shelf (though for a few 100k they'd adapt it for our needs).

I'm not aware of any other tools for generating drainage enforced elevation models, but I'd love to hear about them.

3
  • I actually tried this but the toold crashes a lot. I used the LiDAR derived contours (2K x 2K subset) then removed small insignificant contours to make the surface simpler and tried the TopoToRaster but it just keeps dying. (Too many points in the contour polyline error) Should I just try points elevations instead? Commented May 6, 2011 at 13:27
  • And speaking of CDED I've had all kinds of issues (still unresolved) with the integer rounding and the resulting "terrace anomaly" issues. Commented May 6, 2011 at 13:31
  • I was able to sucessfuly create a "hydrologicaly correct" surface with the TopoToRaster tool by using the LiDAR points as point (spot) input. I created 2 surfaces with different output cell sizes: 2 and 4. Resulting Flow accumulation raster suffers from the same problems. I am beginning to suspect that this cannot be done in ArcGIS. I would also like to point out that it takes extremely long time to run the TopoToRaster. Commented May 6, 2011 at 17:20
5

Back in college I worked on a project that did this quite well. I am not a hydrologist, nor did I finish the project (graduated), but you might want to check this out:

TauDEM 5.0

From what I recall, it worked fairly well. Its a free tool and may be just what you need.

Edit: After reading your question more carefully, I believe this is exactly the tool you need. It has no disconnects as you describe, all the flow continues downstream, i.e. no orphaned streams. Most DEM's calculate flow direction with only 8 possible directions, N,E,S,W and NE,SE,SW,NW. This leads to an unnatural flow. TauDEM has a weighted direction, it can flow in 360 degrees. It will have a more natural flow and I assume a more accurate one.

Also, if you have multiple cores, it will utilize them. Using a high resolution LiDAR, TauDEM should process what you need fairly quickly.

3
  • 2
    I will second this! The D8 flow direction will yield undesirable results on high resolution data where as TauDEM has D-infinity flow direction available. Also, keep in mind the intent of a hydrological flow model. Bigger is not always better (resolution wise). A ultra high-resolution DEM is more your problem than the model. Lidar derived DEM's inherently have real "noise" that was never intended for use in a flow model. I would highly recommend downscaling your DEM. Commented Jan 16, 2013 at 20:00
  • Check out SAGA GIS-softaware too. I'd like to point out that this IS NOT A DEM RELATED issue as the information (that is x,y,z) is always the same in each of the different flow accumulation METHODS (that is D8, Dinfinity, etc .. ). Parrallel processing found in SAGA GIS allows rather fast processing of lidar data, too. I have used these methods to quite large calculations and they worked well. The thing is, that you preprocess your data properly. I.e. burn drainage structures (culverts, bridges) and fill them and THEN make the flow accumulation calculations!
    – reima
    Commented Oct 3, 2014 at 13:18
  • Tau dem had multi processor capability as well Commented Dec 16, 2015 at 12:37
4

Thank you all for you contributions. I have concluded that full resolution LiDAR surface is unsuitable for this type of analysis.

1
  • this article, Terrain Datasets, The top 10 reasons to use them, has got me thinking that a DEM raster surface is just the wrong data model to use in your case. We rejected TINs for our elevation models as the facets produced too many artifacts in our experiments. However our source data were contours and not a dense field of spot heights like Lidar. Commented May 17, 2011 at 16:25
4

Specifically to the question about using integer or floating point: Integer is best for speed, storage and avoids some kinds of drift due to rounding errors. However when using integer don't use meters for your Z (elevation) values! Change the vertical units to centimeters or millimeters, or keep them as meters and scale the values (multiply by 100 or 1000) which has the same effect. If that is not doable use floating point.

Slope & aspect analysis and other 2nd & 3rd order derivitives are particularily sensitive to the crudeness of metres-based integer elevations. It really is bad practice, however it's also standard practice.

See Terrain analysis: principles and applications (John Peter Wilson & John C. Gallant) in particular section 2.7.2 Elevation Units and Vertical Precision, and The Geomorphological Characterisation of Digital Elevation Models (Jo Wood), search for "integer rounding". Both of those documents are weighty. I first became aware of the problem through a concise and understandable description of the problem in a document about building the first continental elevation model for Australia (circa 2000), using the ANUDEM software, but I can't locate it right now.

2
  • 1
    Thanks Matt. Good stuff. I will try this and report back. Lots of very interesting information. Thanks for the effort you put into this. Commented May 6, 2011 at 13:20
  • 1
    When I multiply the input raster by 1000 I get the same results as before. I tried both the integer and the floating point. Resulting Flow Accumulation raster is nearly identical in both cases. Off to try to make the TopoToRaster technique work. Commented May 6, 2011 at 14:26
3

Don't know if this will help but I wrote a blog post awhile back on hydro network for 1cm LIDAR DEM. Might have some nuggets for you.

http://www.thadwester.com/1/post/2011/03/hydrologic-networks.html

7
  • Thanks. Obtaining a continuous Flow Direction raster from which I could derive a usable drainage network especially in flat areas seems to be my major issue. Can you please describe how The D8 method can be used in ArcGIS to produce a flow direction raster? Commented Mar 30, 2012 at 15:33
  • Just to add to this. I think the existing algorithm is not infinite - as if it had a cut-off parameter that does not allow it to track the flow upstream if it determines that there could be memory issues. Commented Mar 30, 2012 at 15:36
  • You can create a Flow Direction raster in Arcgis. I can run it for you if you don't have the capability.
    – Thad
    Commented Apr 10, 2012 at 12:39
  • Sorry i meant flow accumulation in the above comment, not flow direction. This is the initial problem as described in this question. The flow direction tool tool does not yield usable results when run on dense Lidar data in low lying areas. In fact using a floating point raster yields irreparable errors while using integer raster generalizes data too much. As it stands it is impossible to derive an accurate drainage model from LiDAR data using ArcGIS tools alone. Commented Apr 10, 2012 at 12:50
  • I don't understand how the density of the data would matter. The data i use is 1 cm^2. way more dense. Let me download your data, and I will try.
    – Thad
    Commented Apr 10, 2012 at 12:59
1

Just thought I would add something more to think about here. I am now questioning whether the watershed basin delineation process even works. I have a model that I have been manually editing and I am continually coming over areas that are just wrong. I don't think I can rely on ArcGIS computer generated models at all...

Screenshot

Your Answer

By clicking “Post Your Answer”, you agree to our terms of service and acknowledge you have read our privacy policy.

Not the answer you're looking for? Browse other questions tagged or ask your own question.