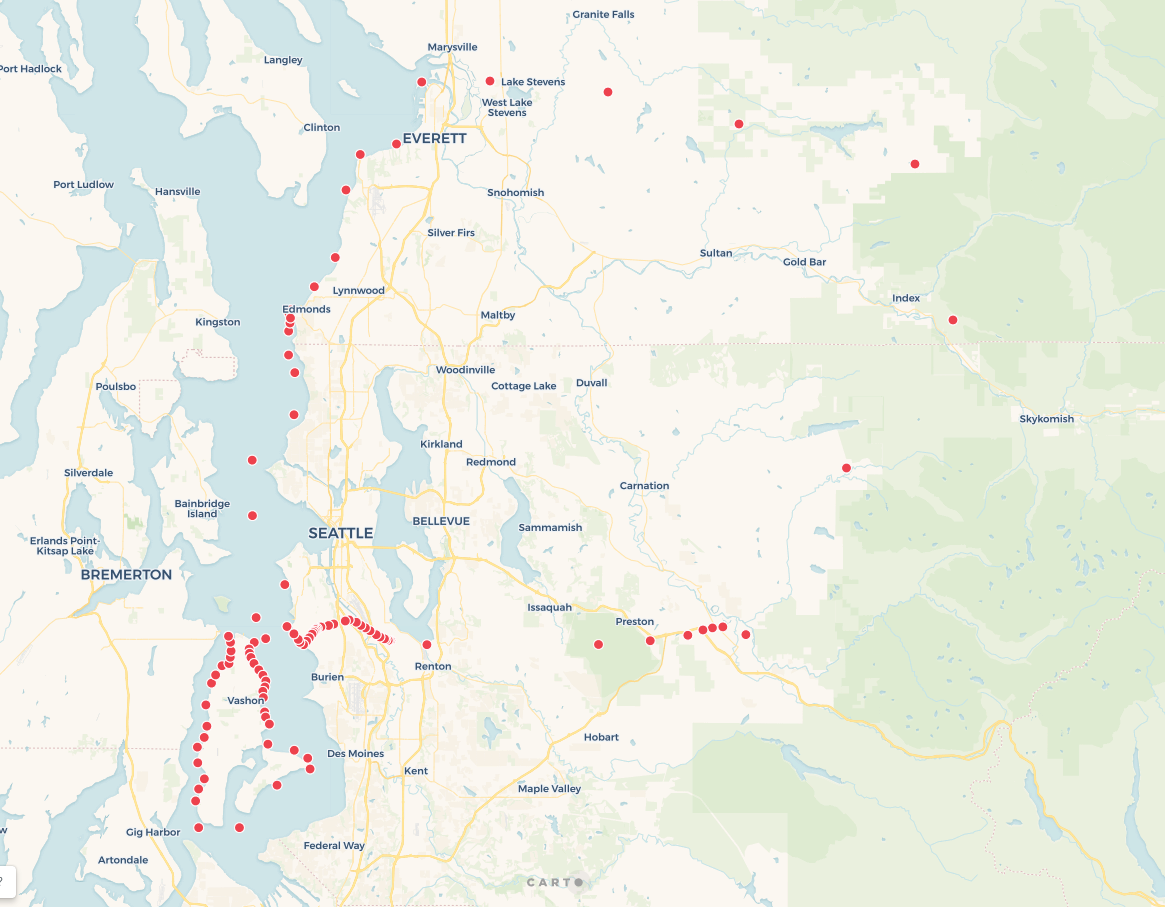
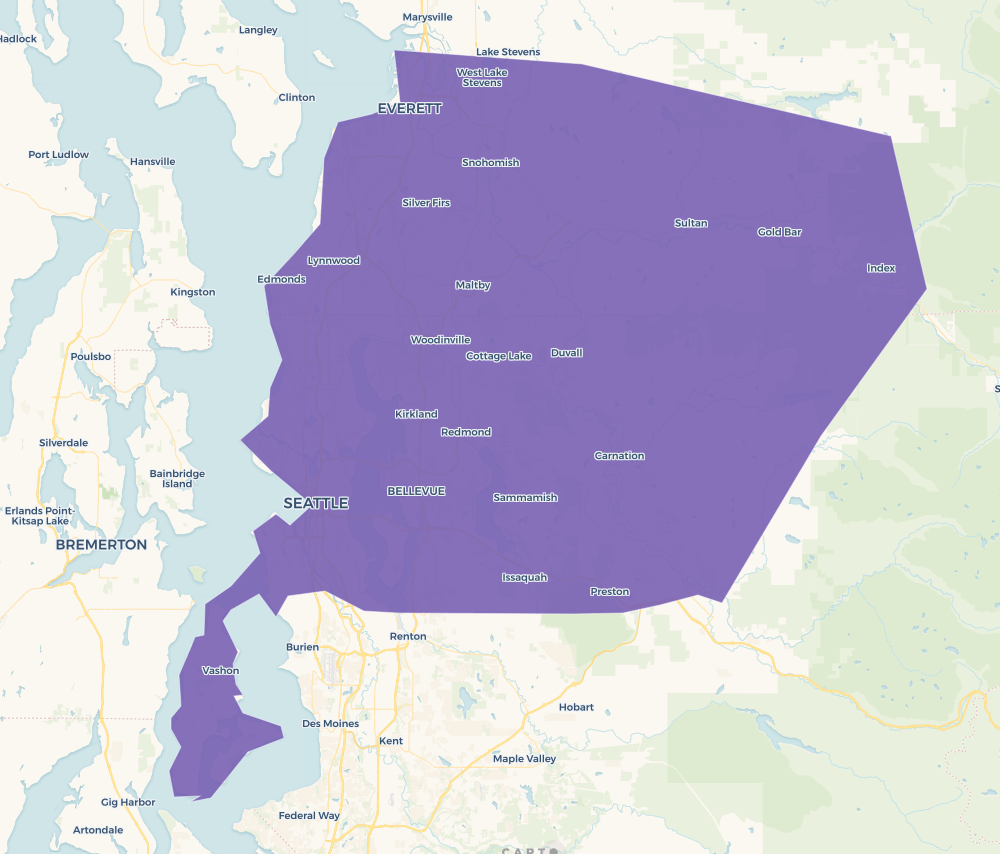
Using Carto, I am trying to create shapefiles of regions using points(Link to Dataset in Carto ) with a shared column value to group by. I've included a photograph of the points and my desired result which I have drawn out by hand below, as well as my failed attempts using concave hull method.
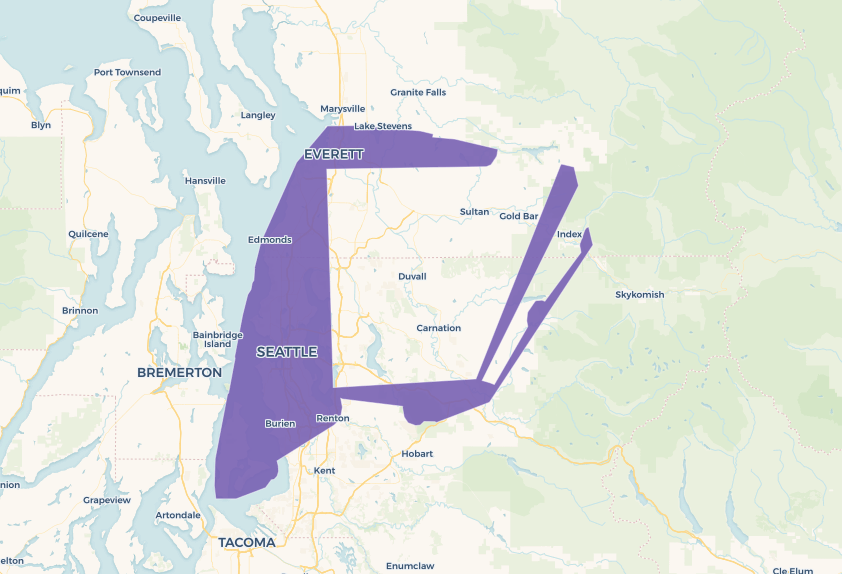
I am using the analysis tool provided by Carto, running a concave hull with various target percent values and poor results. For this example I've included a target percent of 80 and the result is shown in a photograph at the bottom. The code is provided below
SELECT row_number() over() as cartodb_id, territoryid as category, ST_ConcaveHull(ST_Collect(the_geom), 0.8, false) AS the_geom, count(1) as count_vals FROM (SELECT * FROM (SELECT * FROM "st-braund".bd_regions_1) _camshaft_category_filter WHERE territoryid IN (3)) _analysis_source GROUP BY territoryid


