24

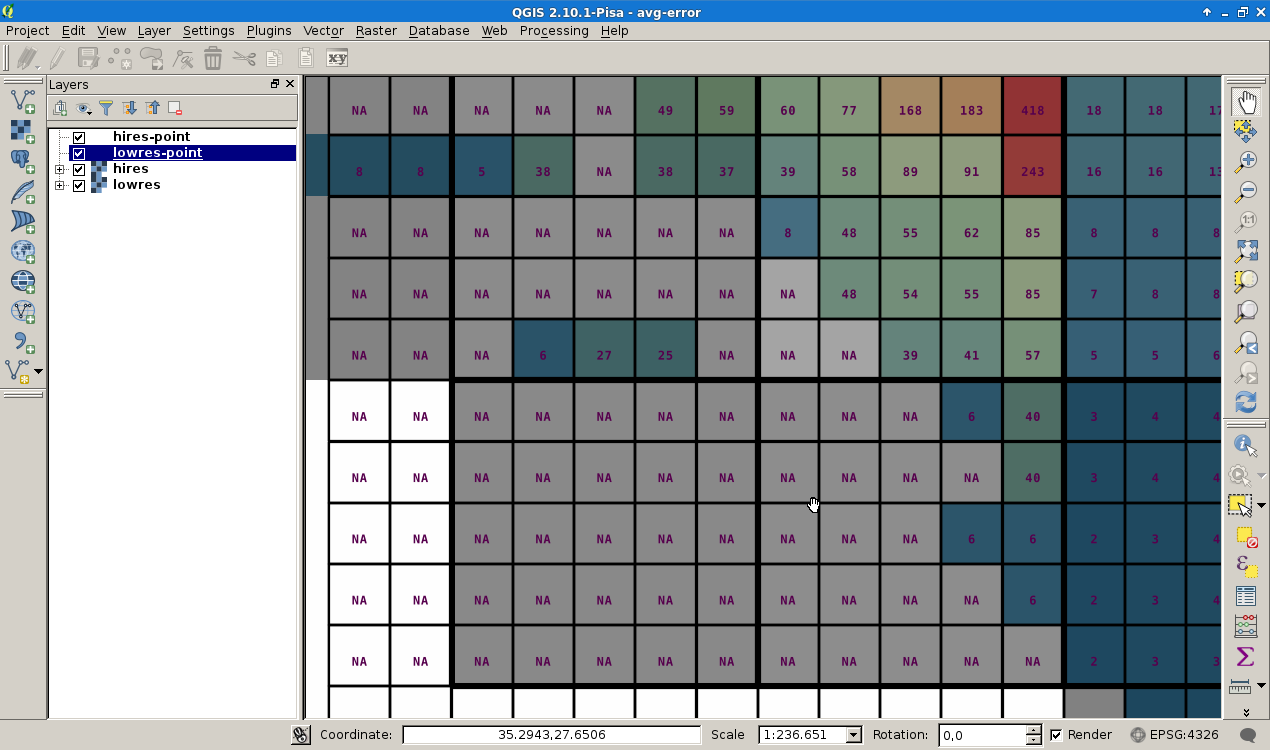
I wonder if there is a raster symbolizer in QGIS with a label option, that renders the cell values as labels of single band raster layer, a scalar field.

raster cells with labels

The standard raster symbolizer dialog in QGIS has no label option. So I use two data sources, a raster (geotiff) and a xyz-vector re-incarnation of the raster to draw the map. To be compatible with the GDAL cell addressing I use

   gdal_translate hires.tif hires-point.xyz -of xyz

and apply all the vector symbology and labeling capabilities on/to the xyz-object.

For large scalar fields, this workaround is very slow and not handy. At least I want to build a map for debugging purposes with this look.

enter image description here

Is there a plugin for QGIS that draws raster cells as shown above without the vector handicraft?

I use Debian Jessie Linux, QGIS Pisa 2.10 and gdal 2.0.1

I try to investigate the results of GDAL raster window operations for example (comment @Paulo).

9
  • 2
    Not exactly what you're asking for, but maybe do this with GDAL bindings for Python (and matplotlib), or R (and spatial)? Commented Feb 27, 2016 at 22:36
  • @Paulo, Yes GDAL and Python is always an option, but I've to build this test setup (gis.stackexchange.com/a/182309/26213), with many of steps and settings and a very slow environment. I want to use the options of a raster symbolizer.
    – huckfinn
    Commented Feb 27, 2016 at 22:41
  • Not quite the answer you are looking for, but displaying would probably be as much time consuming with raster than with points. As you seem to work in integers and with relatively large patches, maybe you could polygonize your raster in order to have less features to label.
    – radouxju
    Commented Mar 5, 2016 at 13:38
  • @radouxju Hm, I made an opposite expierence. I'ved tried to investigate some raster window calculation stuff in this Q&A context (gis.stackexchange.com/a/182309/26213) and started to label the cells here with the uncutted version of the full TIF temp_CHIRPS_201512.tif (7200x2000 cells). This process takes a very long time to import and label the 14.4 Mill points if no spatial index is present. The opeartion runs in a time scale of minutes. So I've cutted the material to a region of interest (1000x1000 cells) and get a handy setup for this example.
    – huckfinn
    Commented Mar 5, 2016 at 15:10
  • my point is that labelling each cel is inefficient. one large area of NaN just requires a single label in a vector based model, That being said I haven't tested it, so I am not sure that this is the best solution in your case (also depends on the number of patches) (therefore I do not put this as an answer)
    – radouxju
    Commented Mar 6, 2016 at 10:55

1 Answer 1

5

this would be a great feature.

In my dreams, I could also double-click on a raster cell and set its value...

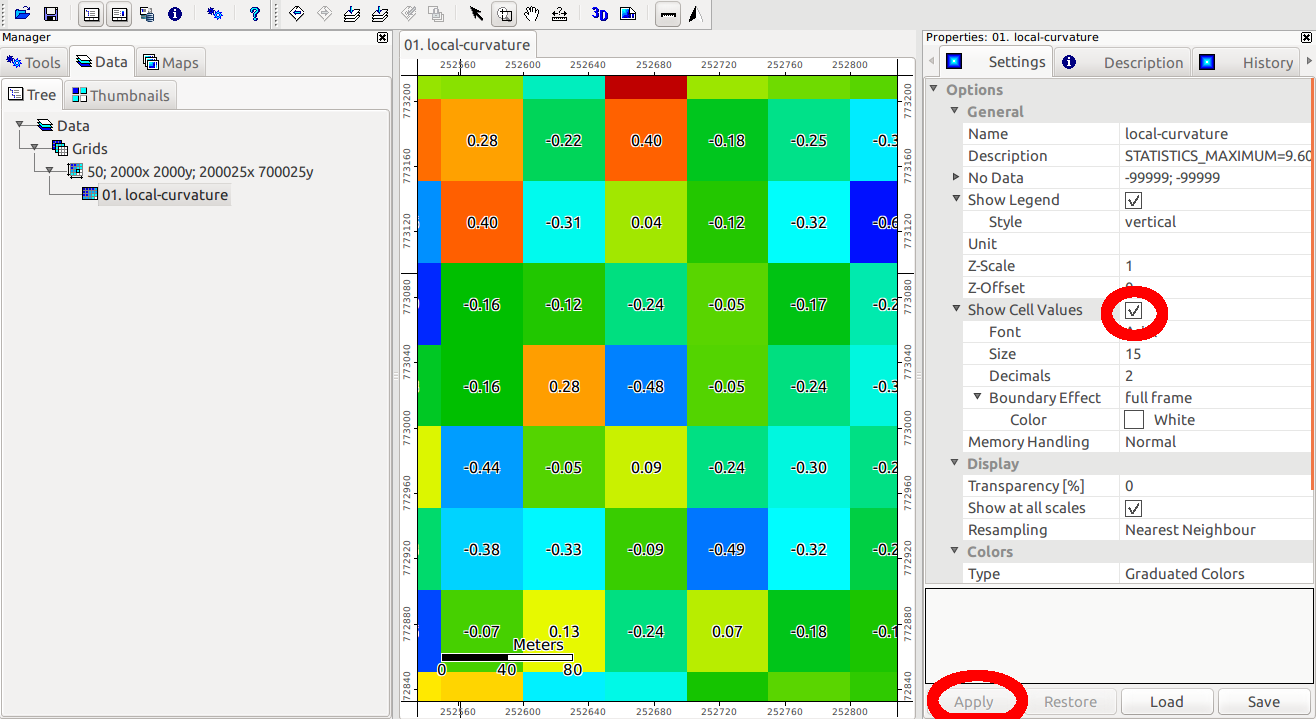
SAGA GIS can render cells like this. These instructions are for SAGA GIS 2.2.6 . There have been a few menu changes in recent versions of SAGA, but this is also possible in older versions.

  • Import your raster using Geoprocessing > File > Grid > Import > Import Raster
  • In properties, check "Show cell values" then "Apply"
  • Zoom right in

This screenshot shows the result...

enter image description here

Your Answer

By clicking “Post Your Answer”, you agree to our terms of service and acknowledge you have read our privacy policy.

Not the answer you're looking for? Browse other questions tagged or ask your own question.