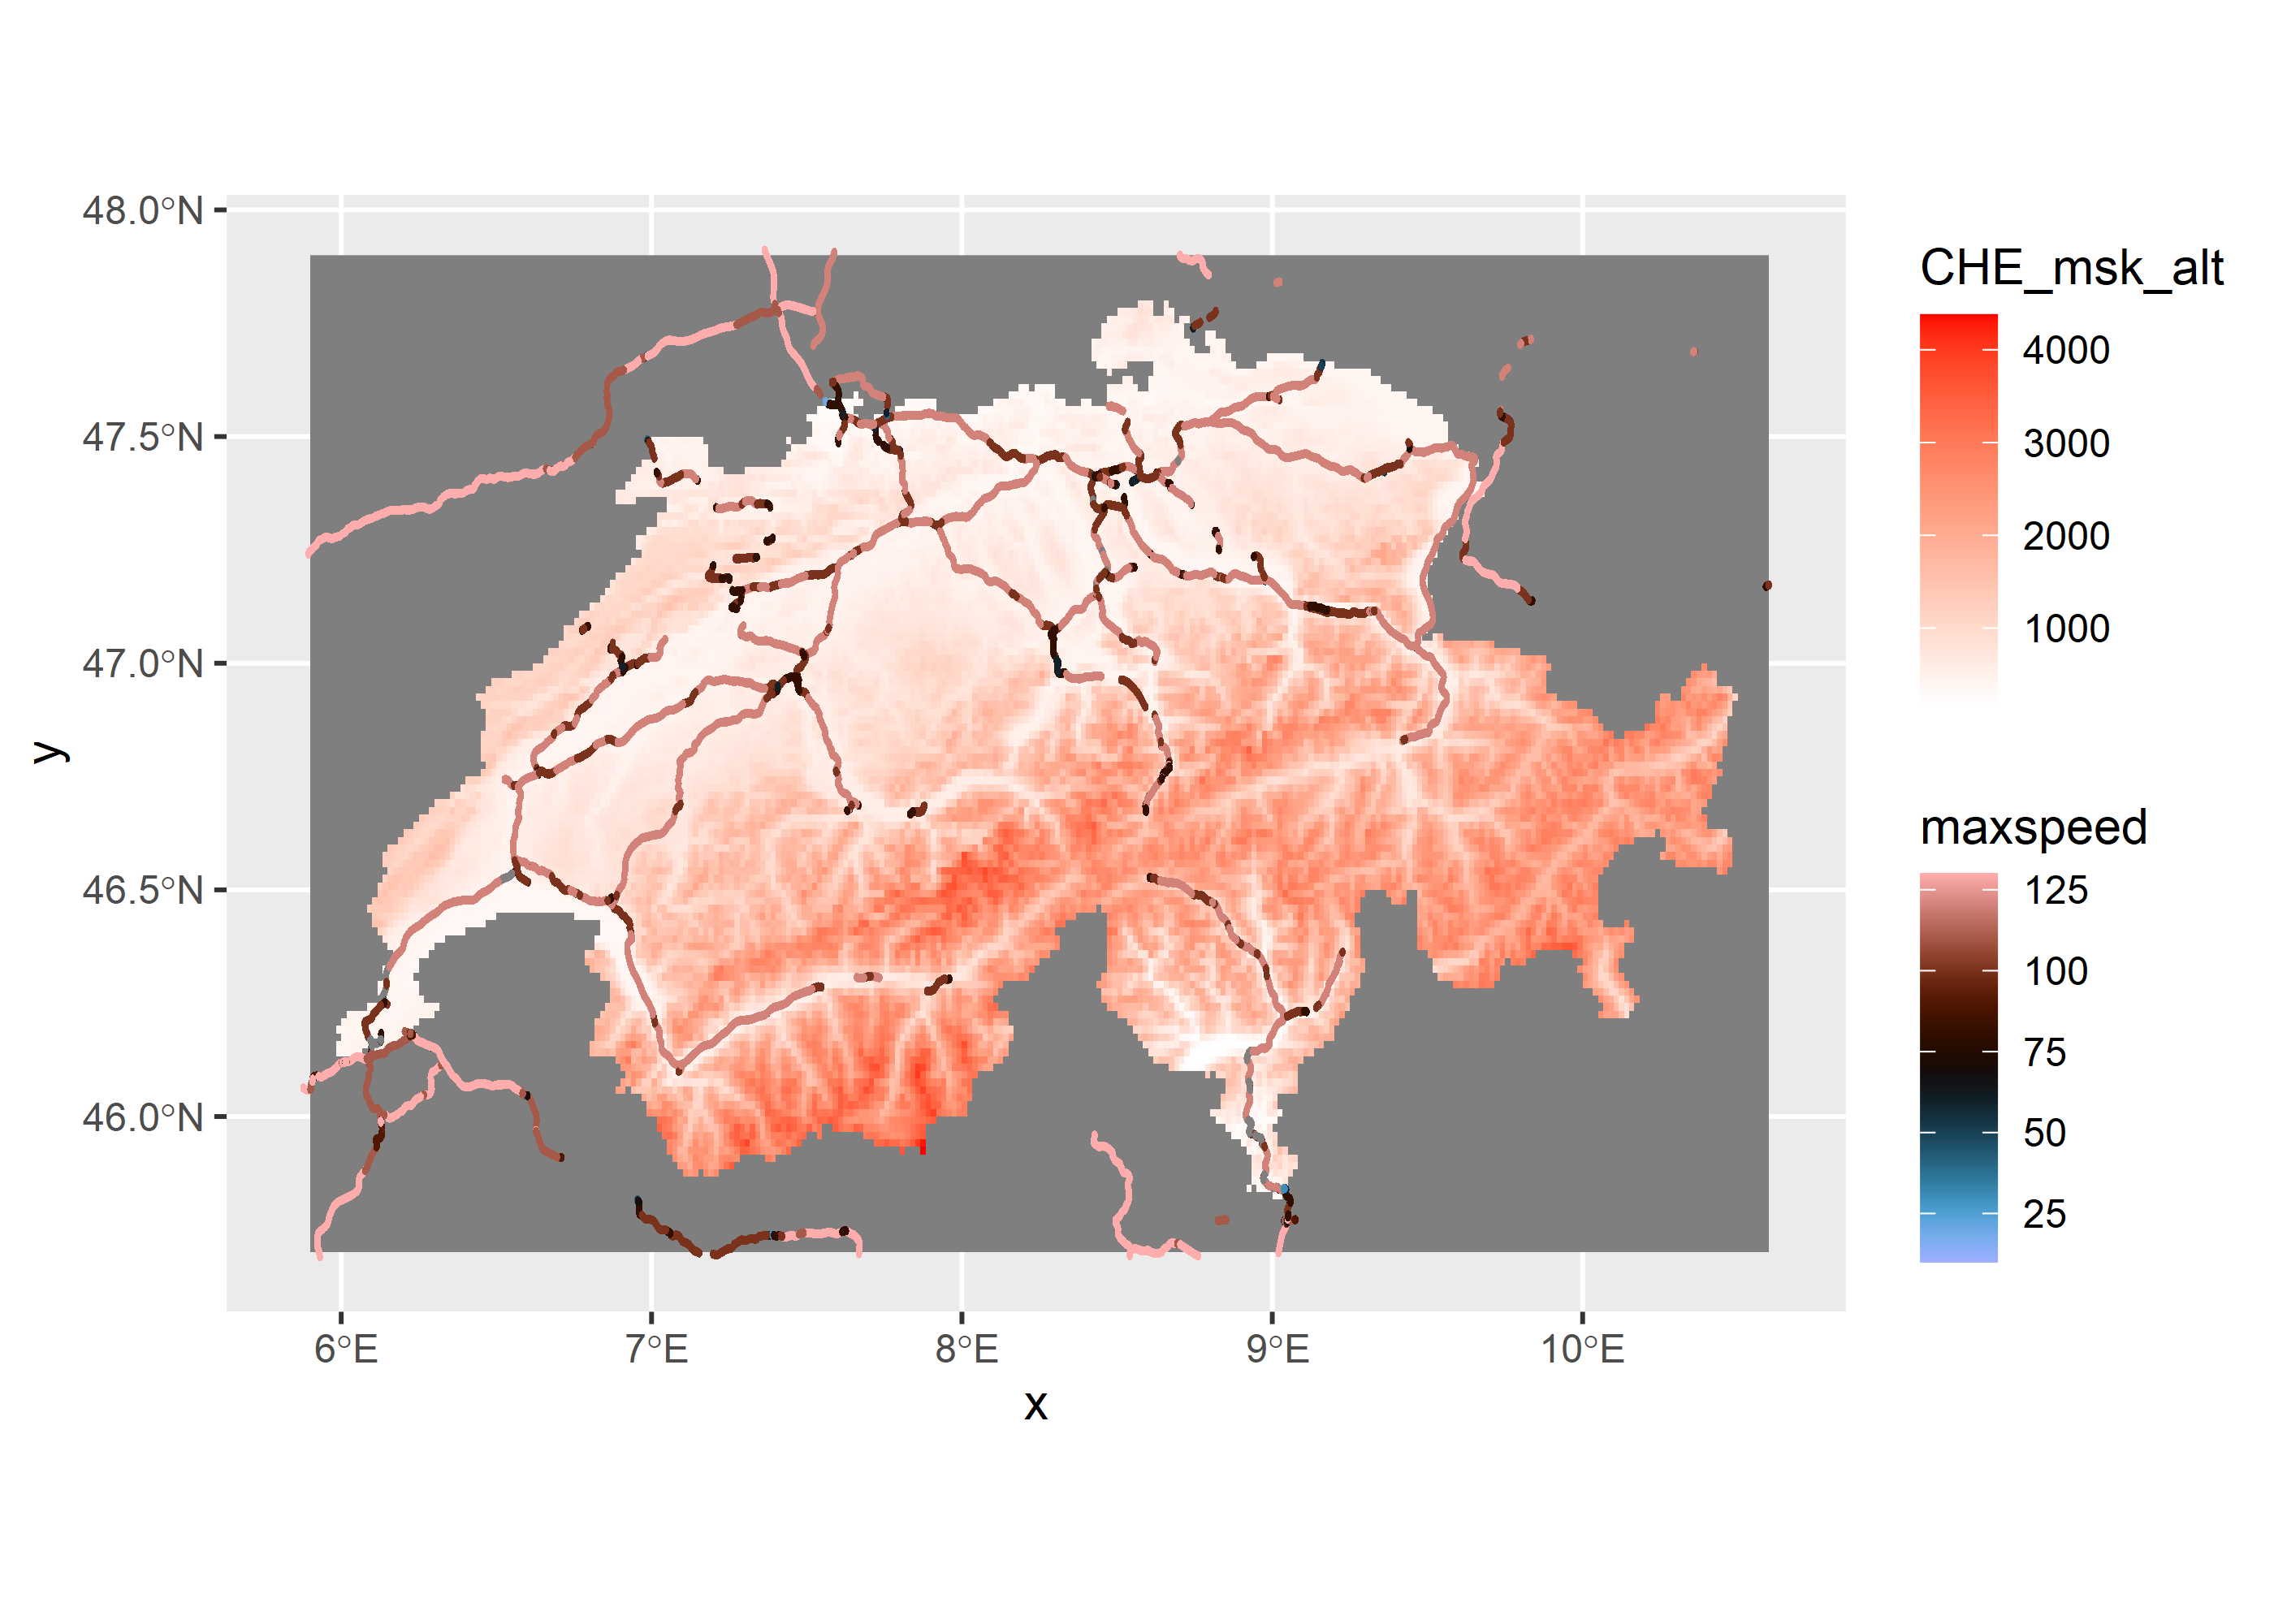
I am a little lost. I have a stars object where I would like to use the first attribute and map it to the
scale_fill*-function in ggplot.
I also have an polygon-object of class sf that has an attribute that I would also like to map to the
scale_fill*-function.
I really tried to compile some data and a reproducible example and I got this far: It does not make any sense at all, but serves for the purpose:
library(stars)
library(tidyverse)
library(raster)
library(osmdata)
library(scico)

# get elevation
alt <- getData('alt', country='CHE')
alt_stars = st_as_stars(alt)

ch_canvas = st_bbox(alt_stars) %>% opq()

# overpass query
ch_moto = ch_canvas %>%
  add_osm_feature(key = "highway",
                  value="motorway") %>%
  osmdata_sf()

# get the sf object
df = ch_moto %>% pluck("osm_lines") %>%
  dplyr::select("maxspeed") %>%
  filter(!is.na(maxspeed),
         maxspeed != "none") %>%
  mutate(maxspeed = as.numeric(maxspeed))

# make the polygons
df_buffer = st_buffer(df, 0.1)

ggplot() +
  geom_stars(
    data = alt_stars,
    aes(x=x, y=y, fill = CHE_msk_alt),
    downsample = 2
  ) +
  scale_fill_continuous(low="white", high="red") +
  geom_sf(
    data = df,
    aes(fill=maxspeed)
  ) +
  scale_fill_scico(palette="berlin")
I am then getting this message:
Scale for 'fill' is already present. Adding another scale for 'fill', which will replace the existing scale.
I would just like to know how to plot any two layers (in many cases a stars-object and a sf-object) on top of each other and fill both according to the values in a variable.
I tried to use the cowplot-package and just define two ggplot objects and plot them above each other, but did not manage to make it work.
Maybe someone has a pointer on what to do in these situations:)


tmapfor this