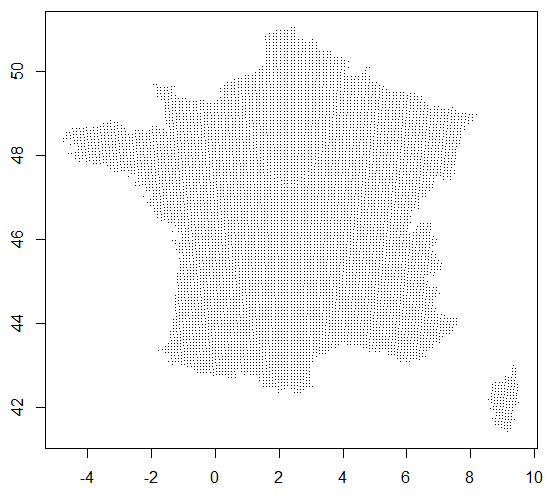
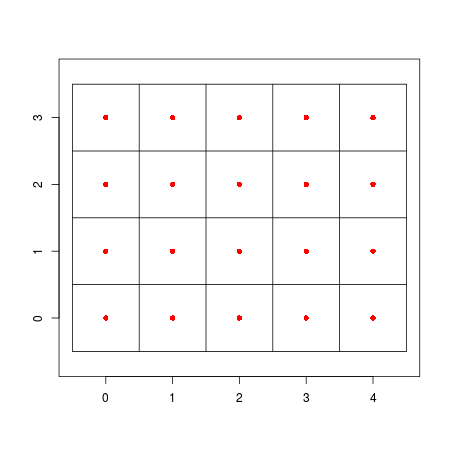
Final solution:
library("sp")
library("sf")
library("raster")
library("parallel")
library("ggplot2")

df=read.table("~/centroids.csv",sep=",",header=TRUE)

df2=df
coordinates(df2)=~longitude+latitude
proj4string(df2)=CRS("+init=epsg:4326") # points are initially projected in WGS84
df2=spTransform(df2,CRS("+init=epsg:27572")) # points are distributed on an approximatly regular grid in NTF Lambert Zone II (thank you @FSimardGIS !!!)

grid=points2grid(df2,tolerance=0.00587692) # 0.00587692 is the minimum value I found by hand, by trial and error
grid=as.data.frame(SpatialGrid(grid))
coordinates(grid)=~longitude+latitude

grid=rasterFromXYZ(grid)
grid=rasterToPolygons(grid)
grid=st_as_sf(grid)
st_crs(grid)=27572
grid=st_transform(grid,crs="+init=epsg:4326") # re-projection of the grid in the initial projection of df values which are in WGS84

cl=makeCluster(spec=(detectCores()-1)) # parallel computation in order to know which cells from grid actually contain points from df
clusterEvalQ(cl,library("sf"))
clusterExport(cl,c("grid","df"))
df$gridLoc=parApply(cl,df,1,function(row){
  pnt=st_sfc(st_point(c(row["longitude"],row["latitude"])),crs=4326)
  id=row["ID"]
  return(as.numeric(st_intersects(pnt,grid)))
})
stopCluster(cl)

grid=grid[df$gridLoc,] # selection of cells from grid that actually contain points from df
grid$layer=df$ID # transfert the ID of centroids to the coresponding cell of the grid

x11()
ggplot()+
  geom_sf(aes(fill=layer),col="black",data=grid)+
  geom_point(aes(x=longitude,y=latitude),pch=21,fill="white",col="black",size=.9,data=df)+
  scale_fill_gradient2(low="#47fe44",mid="#f8fe44",high="#fe4444",midpoint=5000)
Which give this nice plot (color layer corresponds to the initial ID of spatial points in df, white dots correspond to the initial centroids from df):
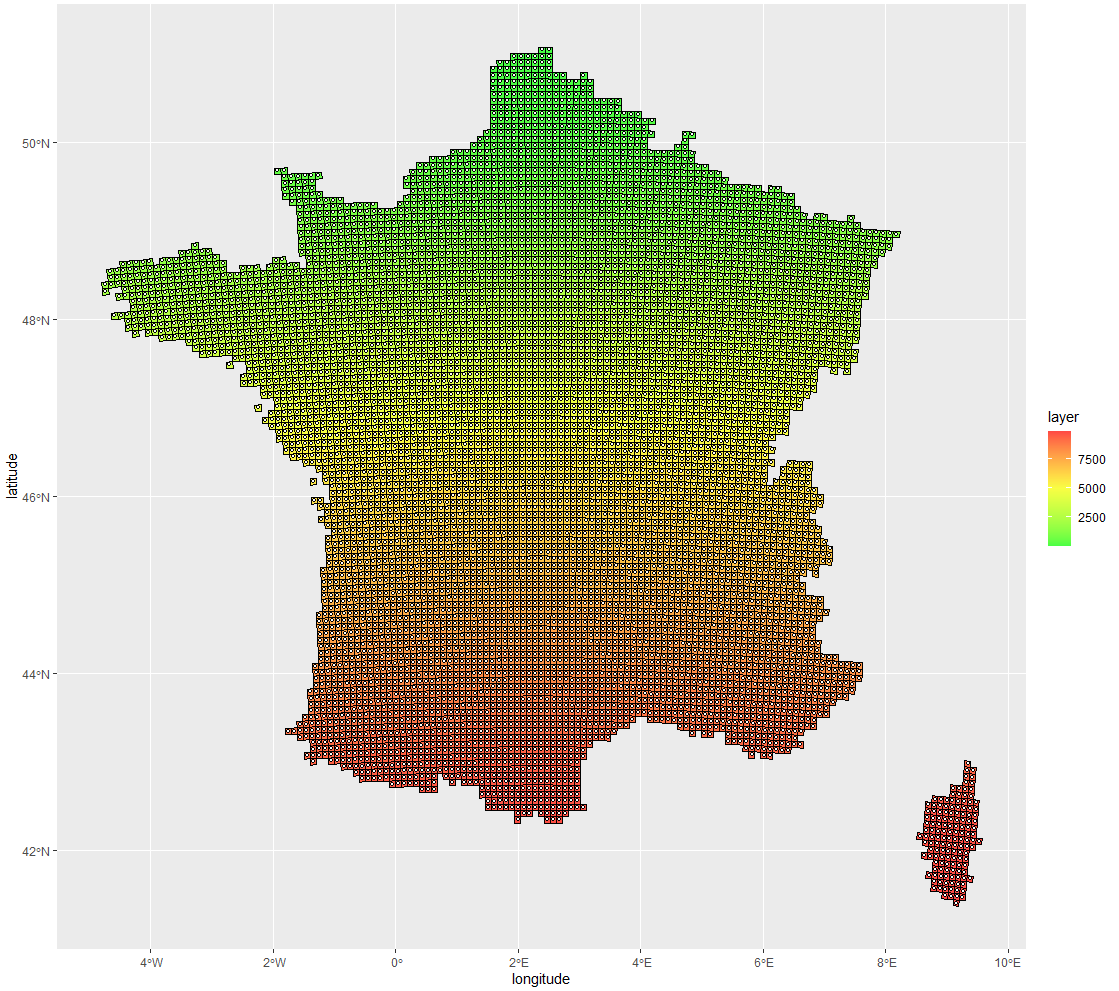
Even if some points seem to be a bit off-center from the cell, its only a plotting artifact due to the high resolution, as we can see here with increased zoom on Corsica:
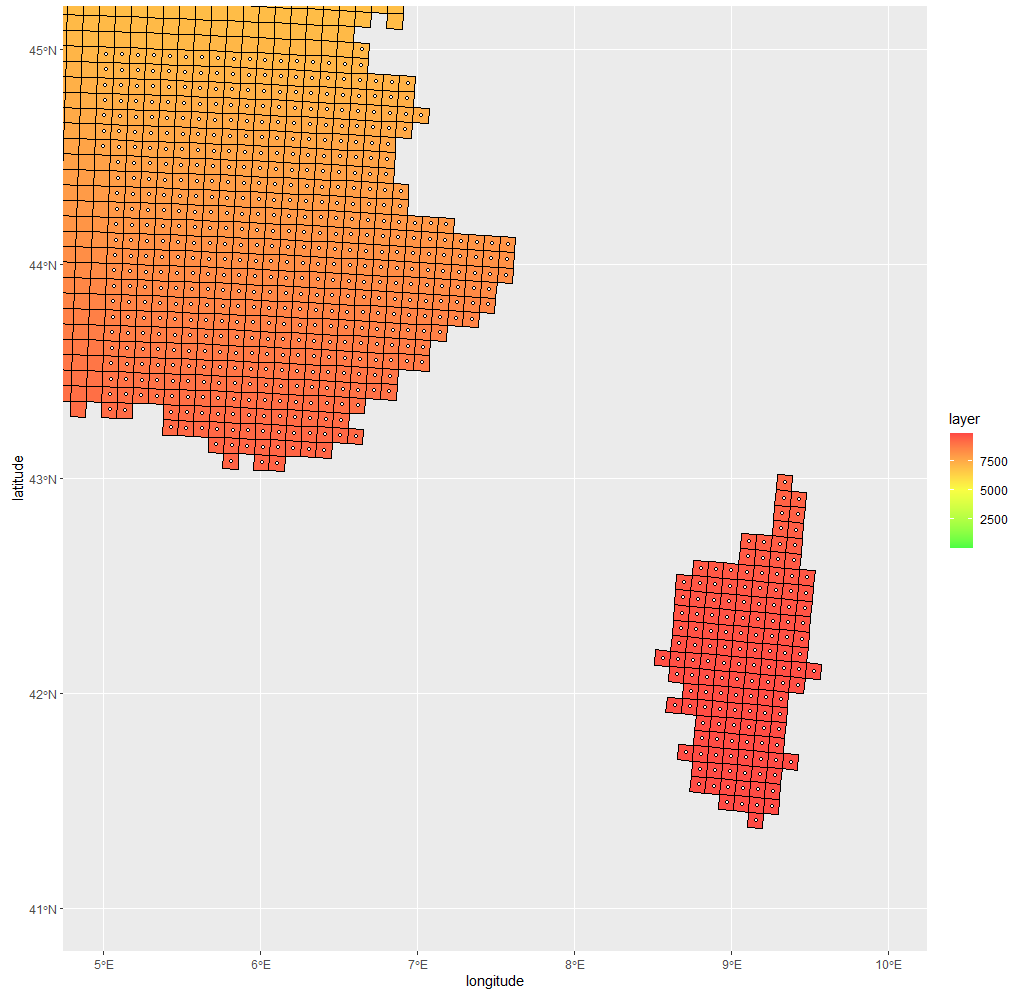
The answer to this post is therefore : (1) find the right projection in which points form a regular grid; (2) use gridded() or points2grid() to compute the regular grid; (3) transform the grid points into a raster using rasterFromXYZ(); (4) transform the raster into polygons using rasterToPolygons(); (5) re-project the polygons into the initial projection using st_transform(); (6 optional) if you do not want to keep all created cells within the grid, use st_intersects() to find which cells actually contains initial points.
Thanks a lot for your advices !
Testing the grid centroid offsets:
I can compute the centroids of the grid and compare their location to the initial centroids:
estimatedCentroids=st_centroid(grid) # new centroids from grid

coordinates(df)=~longitude+latitude
proj4string(df)=CRS("+init=epsg:4326")
trueCentroids=st_centroid(st_as_sf(df)) # initial centroids from df

centroidsOffset=st_distance(estimatedCentroids,trueCentroids,by_element=TRUE) # compute distance of each pair of centroids between grid and df

hist(centroidsOffset,nclass=100)
With the final solution that I present above, I therefore make an average error of 550m (range from 170m to 900m):
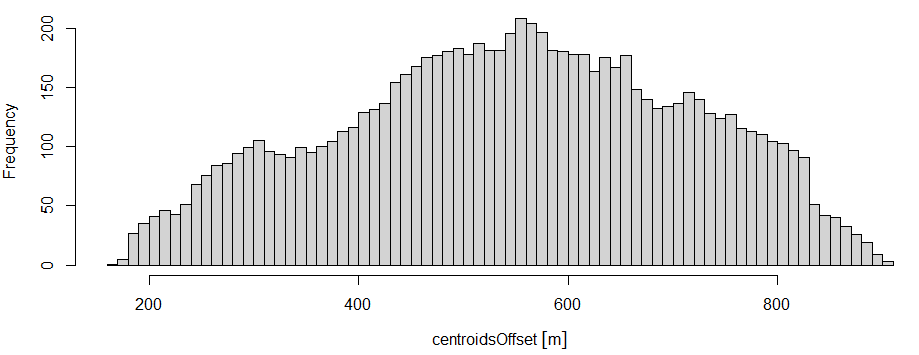
If I well understand the methodology, this is due to the use of the points2grid() function with a tolerance parameter of 0.00587692. Which means that points are not distributed on a true regular grid, even in the NTF Lambert Zone II projection (which still the better I found).

