0

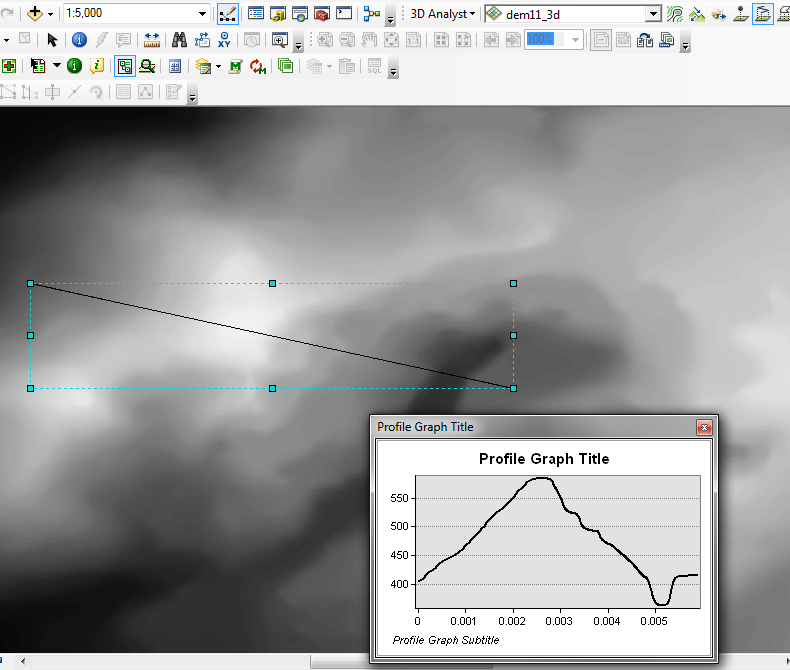
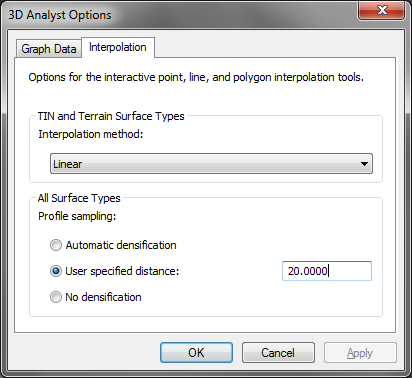
I have a problem when I want to create a vertical profile in 3D Analyst from a DEM file. I want to interpolate the data and show points from 20 to 20 meters, as I specified in the option panel (see figure 1). After I press the button to show the Profile Graph, the X-axis do not show values between 20 meters as I specified in the option panel (see figure 2). What can I do to solve this issue?

Note: the Y-axis is displayed correctly in terms of altitude. Datum: WGS_1984
enter image description here enter image description here

1
  • 1
    You've requested vertices every 20 degrees, not every 20 meters. You'd have to project the raster or use a linear approximation for 20m in Cartesian decimal degrees.
    – Vince
    Commented Jun 9, 2014 at 17:55

1 Answer 1

3

Vince's comment partially answers your problem - your data is in degrees, so the x axis or length is also going to be displayed in degrees rather than meters.

However I think you're also confusing what Profile Sampling actually does. It will not change the values or labels of your x axis - that's the length of your line in whatever units of measure your CRS is. When you specify a value for profile sampling, that means in addition to getting an elevation value for every vertex in your profile line, it will also get an elevation value every 20m along that line. The purpose is to increase the vertical resolution of (smooth out) the profile line.

0

Your Answer

By clicking “Post Your Answer”, you agree to our terms of service and acknowledge you have read our privacy policy.

Not the answer you're looking for? Browse other questions tagged or ask your own question.