11

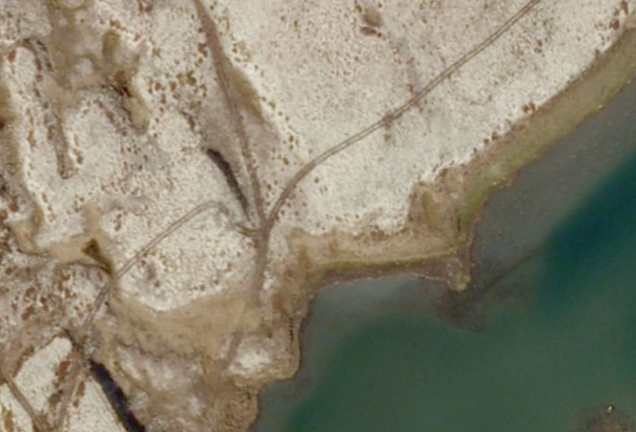
Given an area with depressions in open area from; say all terrain vehicles driving on soft surface. The vehicles will cause parallel depressions (paths) of about 10-20 centimeters in depth and around 15-30 cms in width, with lengths varying with the robustness of the surface.

  • Which remote sensing platforms would be relevant for later analysis? Quickbird, smaller drones, lidar, aerial photography?
  • Are there any available procedures in tools (FME/QGIS/ESRI/other) which can be used to document the paths?

Let us for the sake of simplifying this question assume that we positively know that there are no other paths in the area, or that they have been filtered out of the imagery.

Full automation is not necessary, and probably not even possible.

This is an example of what tracks would look like. enter image description here
9
  • 4
    That's a good question. Usually I prefer two platforms - one to find, one to confirm. A depression that's brown is more likely to be a wheel rut, conversely non-wheel depressions are more likely to be 'green'. LiDAR will give you the best DEM to find depressions and IR is the best at classifying vegetation/not vegetated. Be aware that LiDAR, depending on many factors, will give different results where water has pooled. Traditionally these would be captured from photography alone, which is a lot of hours work, but you have to weigh up the cost of labor vs data acquisition. Commented Dec 17, 2014 at 22:27
  • 2
    I assume your ultimate goal is to identify off-road tracks. What is the extent of your study area? Where is the study area?
    – Aaron
    Commented Dec 17, 2014 at 22:48
  • 2
    Thanks Aron, yes it is related to off-road tracks. We aim at documenting them to get an indication of the extent of any damage. We would probably limit it to some management unit like nature reserves, national parks or similar. Per now we are trying to figure out our options before designing a project.
    – ragnvald
    Commented Dec 17, 2014 at 22:55
  • 1
    I'm not sure about LiDAR on snow (don't get much of that in Queensland), open spaces are a lot easier to classify and you can get away with cheaper sensors (less returns per pulse).. in heavily vegetated areas it is imperative to use multiple returns per pulse to find the ground; the pulse density is the same but less returns. To find your furrows your point spacing will have to be quite fine (in excess of 8 pulses/sq.m.) which means lower flying, more strips, more cost, more storage, longer processing time. It could be a lot cheaper to get capture from photography done in China or India. Commented Dec 18, 2014 at 0:31
  • 1
    I should qualify my previous statement, if you've got to acquire LiDAR and multispectral imagery for this project and can't offset the cost (co-purchasing with another company or government department that has separate interests in the same area) the cost is going to be high, probably higher than capture, provided you can source labor at a low rate. I'm not saying it's impossible, far from it, it would be very interesting as a white paper, just probably not the cheapest option. Commented Dec 18, 2014 at 3:26

1 Answer 1

4

I'm not sure can be the best solution for your goal, but my experience with SAR data suggests It could be the right way to find out tracks in Savannah and sandy environment.

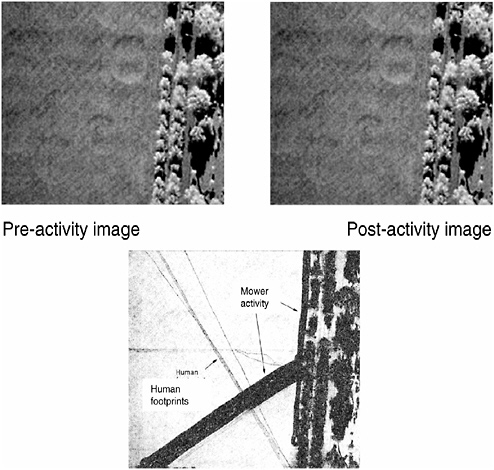
As SAR is a coherent imaging system two forms of change detection may be considered, namely incoherent and coherent change detection. Incoherent change detection identifies changes in the mean backscatter power of a scene typically via an average intensity ratio change statistic (amplitude signal). Coherent change detection on the other hand, identifies changes in both the amplitude and phase of the transduced imagery using the sample coherence change statistic. Coherent change detection thus has the potential to detect very subtle scene changes to the sub-resolution cell scattering structure that may be undetectable using incoherent techniques. In other word vehicles or animals tracks.

Thanks to the Coherence Change Detection (CCD) you are able to obtain a coherent map of phase(panchromatic). White pixel means coherent signal (no changes), black pixel means incoherent signal (changes). Where you can find parallel tracks for a length of interest then it means should be interesting more investigation.

enter image description here

Of course, it depends on the wavelength of the phase and time factor.
The repeat pass SAR imagery however, must be acquired and processed interferometrically.

Mainly there are 2 good tools to perform this kind of analysis: Erdas with Radar Mapping Suite and ENVI with SarScape module.

My assessment is devoid of economic aspects.

1
  • This method assumes that there are images showing pre- and post-activity.Given that we in some cases only will have 5 year old (pancromatic) images we should expect a lot of noise and thus this method might be problematic.
    – ragnvald
    Commented Jan 7, 2015 at 7:45

Your Answer

By clicking “Post Your Answer”, you agree to our terms of service and acknowledge you have read our privacy policy.

Not the answer you're looking for? Browse other questions tagged or ask your own question.