10

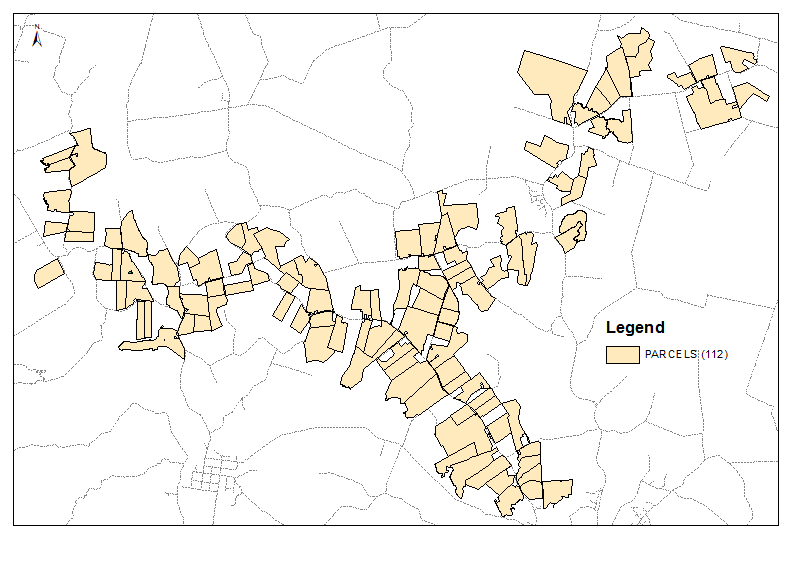
One of my tasks for work is to divide parcels into groups. These groups will be used by agents to talk to property owners. The goal is to make the agent's job easy by grouping parcels that are near each other together, as well as divide the parcels into equal numbers so that the work is distributed evenly. The number of agents can fluctuate from a couple to 10+.

Currently I perform this task manually, but would like to automate the process if at all possible. I've explored various ArcGIS tools, but none seem to suit my need. I tried a script (in python) that makes use of near_analysis and selecting of polygons, but it's rather random and takes forever to accomplish a semi-correct result that then takes me longer to fix than if I just did everything manually from the start.

Is there a reliable method to automate this task?

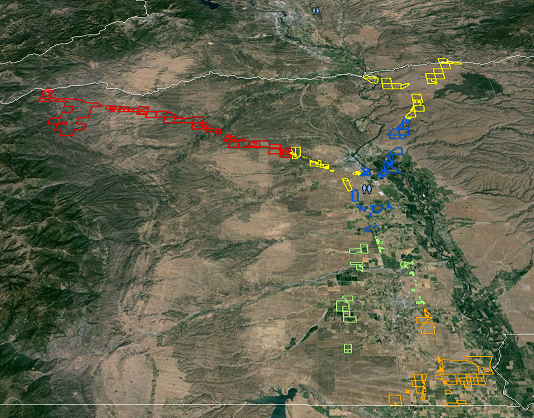
Results example (hopefully without the division we see in yellow):

Divided Parcels

4
  • Have you looked into location-allocation analysis? help.arcgis.com/en/arcgisdesktop/10.0/help/index.html#/…
    – phloem
    Commented Jan 26, 2015 at 19:00
  • Have you tried Grouping Analysis (Spatial Statistics) ?
    – FelixIP
    Commented Jan 26, 2015 at 19:09
  • I also posted a pseudo-code of actual procedure I am using, see if it might help gis.stackexchange.com/questions/123289/…
    – FelixIP
    Commented Jan 26, 2015 at 19:15
  • @crmackey I appreciate the link to my answer, but I'm not sure how you could tweak the linked code (splitting polygons) to fit this problem (grouping polygons).
    – phloem
    Commented Jan 26, 2015 at 21:01

7 Answers 7

4

Original set:

enter image description here

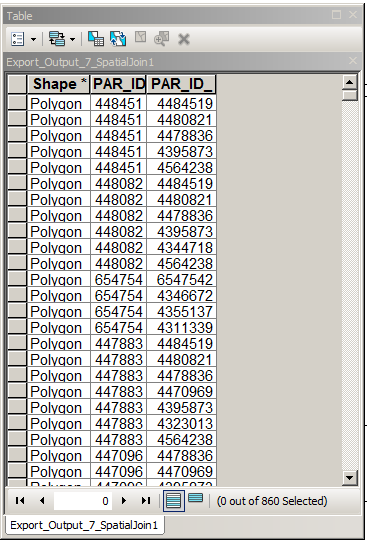
Create pseudo-copy (CNTRL-drag in TOC) of it and make spatial join one to many with clone. In this case I used distance 500m. Output table:
enter image description here

  1. Remove records from this table where PAR_ID = PAR_ID_1 - easy.

  2. Iterate through table and remove records where (PAR_ID,PAR_ID_1 )=(PAR_ID_1, PAR_ID) of any record above it. Not so easy, use acrpy.

Calculate catchment centroids (UniqID=PAR_ID). They are nodes or network. Connect them by lines using spatial join table. This is separate topic surely covered somewhere on this forum.
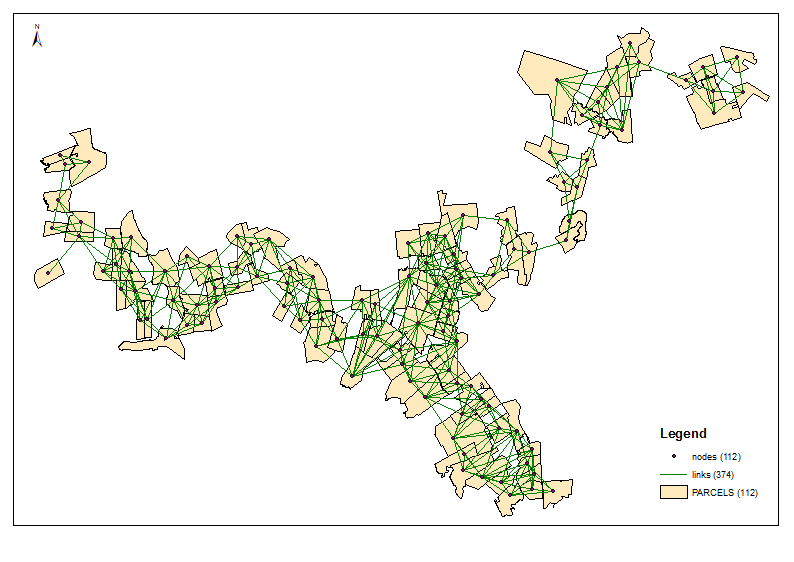
enter image description here

The script below assumes that nodes table looks like that: enter image description here
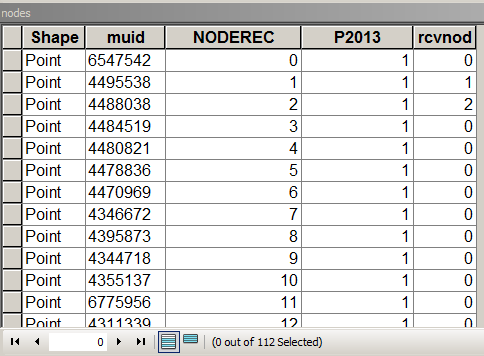
where MUID came from parcels, P2013 is field to summarise. In this case = 1 for counting only. [rcvnode] - script output to store group ID equal NODEREC of the first node in the group/cluster defined.

Links table structure with important fields highlighted
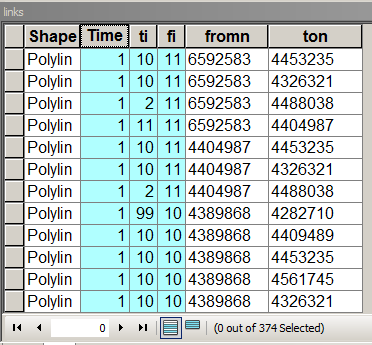
enter image description here

Times stores link/edge weight, i.e. cost of travel from node to node. Equal 1 in this case so that cost of travel to all the neighbours is the same. [fi] and [ti] are sequential number of connected nodes. To populate this table search this forum on how to assign from and to nodes to link.

Script customised for my own workbench mxd. Has to be modified, hardcoded with your naming of the fields and sources:

import arcpy, traceback, os, sys,time
import itertools as itt
scriptsPath=os.path.dirname(os.path.realpath(__file__))
os.chdir(scriptsPath)
import COMMON
sys.path.append(r'C:\Users\felix_pertziger\AppData\Roaming\Python\Python27\site-packages')
import networkx as nx
RATIO = int(arcpy.GetParameterAsText(0))

try:
    def showPyMessage():
        arcpy.AddMessage(str(time.ctime()) + " - " + message)
mxd = arcpy.mapping.MapDocument("CURRENT")
theT=COMMON.getTable(mxd)

FIND NODES LAYER

theNodesLayer = COMMON.getInfoFromTable(theT,1)
theNodesLayer = COMMON.isLayerExist(mxd,theNodesLayer)

GET LINKS LAYER

    theLinksLayer = COMMON.getInfoFromTable(theT,9)
    theLinksLayer = COMMON.isLayerExist(mxd,theLinksLayer)
    arcpy.SelectLayerByAttribute_management(theLinksLayer, "CLEAR_SELECTION")        
    linksFromI=COMMON.getInfoFromTable(theT,14)
    linksToI=COMMON.getInfoFromTable(theT,13)
    G=nx.Graph()
    arcpy.AddMessage("Adding links to graph")
    with arcpy.da.SearchCursor(theLinksLayer, (linksFromI,linksToI,"Times")) as cursor:
            for row in cursor:
                (f,t,c)=row
                G.add_edge(f,t,weight=c)
            del row, cursor
    pops=[]
    pops=arcpy.da.TableToNumPyArray(theNodesLayer,("P2013"))
    length0=nx.all_pairs_shortest_path_length(G)
    nNodes=len(pops)
    aBmNodes=[]
    aBig=xrange(nNodes)
    host=[-1]*nNodes
    while True:
            RATIO+=-1
            if RATIO==0:
                    break
            aBig = filter(lambda x: x not in aBmNodes, aBig)
            p=itt.combinations(aBig, 2)
            pMin=1000000
            small=[]
            for a in p:
                    S0,S1=0,0
                    for i in aBig:
                            p=pops[i][0]
                            p0=length0[a[0]][i]
                            p1=length0[a[1]][i]
                            if p0<p1:
                                    S0+=p
                            else:
                                    S1+=p
                    if S0!=0 and S1!=0:
                            sMin=min(S0,S1)                        
                            sMax=max(S0,S1)
                            df=abs(float(sMax)/sMin-RATIO)
                            if df<pMin:
                                    pMin=df
                                    aBest=a[:]
                                    arcpy.AddMessage('%s %i %i' %(aBest,sMax,sMin))
                            if df<0.005:
                                    break
            lSmall,lBig,S0,S1=[],[],0,0
            arcpy.AddMessage ('Ratio %i' %RATIO)
            for i in aBig:
                    p0=length0[aBest[0]][i]
                    p1=length0[aBest[1]][i]
                    if p0<p1:
                            lSmall.append(i)
                            S0+=p0
                    else:
                            lBig.append(i)
                            S1+=p1
            if S0<S1:
                    aBmNodes=lSmall[:]
                    for i in aBmNodes:
                            host[i]=aBest[0]
                    for i in lBig:
                            host[i]=aBest[1]
            else:
                    aBmNodes=lBig[:]
                    for i in aBmNodes:
                            host[i]=aBest[1]
                    for i in lSmall:
                            host[i]=aBest[0]

    with arcpy.da.UpdateCursor(theNodesLayer, "rcvnode") as cursor:
            i=0
            for row in cursor:
                    row[0]=host[i]
                    cursor.updateRow(row)
                    i+=1

            del row, cursor
except:
    message = "\n*** PYTHON ERRORS *** "; showPyMessage()
    message = "Python Traceback Info: " + traceback.format_tb(sys.exc_info()[2])[0]; showPyMessage()
    message = "Python Error Info: " +  str(sys.exc_type)+ ": " + str(sys.exc_value) + "\n"; showPyMessage()

Output example for 6 groups:
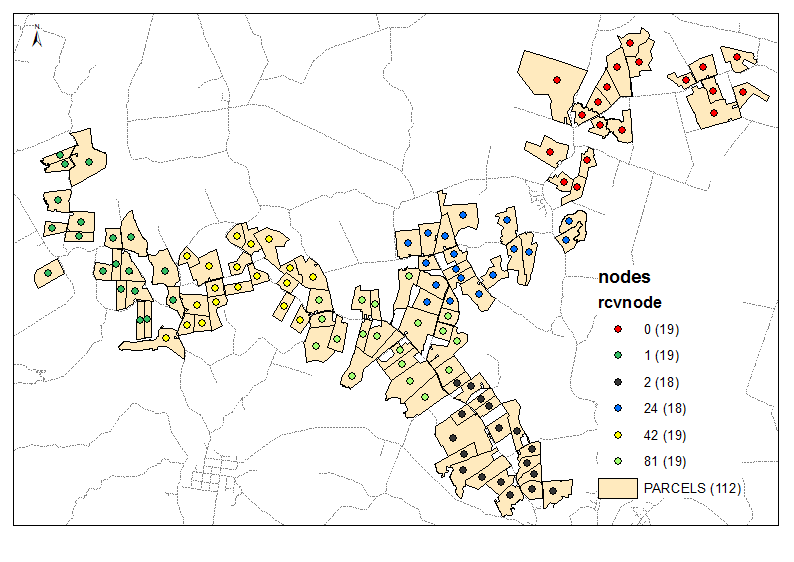
enter image description here

You'll need site package NETWORKX http://networkx.github.io/documentation/development/install.html

Script takes required number of clusters as parameter (6 in above example). It is using nodes and links tables to make a graph with equal weight/distance of travel edges (Times=1). It considers combination of all nodes by 2 and calculates total of [P2013] in two groups of neighbours. When required ratio achieved, e.g. (6-1)/1 at first iteration, continues with reduced ratio target, i.e. 4, etc. till 1. Starting points are of huge importance so make sure your 'end' nodes are sitting on the top of your nodes table (sorting?) See first 3 groups in the example output. It helps to avoid 'branch cutting' at every next iteration.

Script customisation to work from mxd:

  1. you don't need import COMMON. It is my own thing, that reads my own environment table, where theNodesLayer, theLinksLayer, linksFromI, linksToI specified. Replace relevant lines with your own naming of nodes and links layers.
  2. Note that field P2013 can store anything, e.g. number of tenants or parcel area. If so you might cluster polygons to hold approximately equal number of person etc.
5
  • In reality nodes and links layers are just visual things. Cleaned-up table of spatial join can easily replace link table, because from and to nodes are already assigned. Polygons table, can easily serve as nodes table, just add ReceivingNode field and transfer sequential numbers from it back to 'links' [FromI] and [ToI].
    – FelixIP
    Commented Jan 30, 2015 at 2:35
  • This looks good. Thanks so much for the answer. Can you explain more of the why, and not just the how? Comments on your code would be huge. Commented Jan 30, 2015 at 16:02
  • Please follow hyperlink in my earlier comment to your question. I've tried to explain the approach, if this is what 'why' means. I withdraw my comment regarding importance of starting node, because after posting answer to your Q, i randomly changed records order trying to kill script. Nothing happened it still produced reasonable results.
    – FelixIP
    Commented Jan 31, 2015 at 19:49
  • To clean-up spatial join table it is enough to delete PAR_ID=PAR_ID_1, because edge/link [0,2] in undirected graph of NETWORKX equal edge[2,0]. I can post updated script, not sure if it will affect my reputation
    – FelixIP
    Commented Feb 3, 2015 at 19:54
  • @EmilBrundage have a look, it might help with why question gis.stackexchange.com/questions/165057/…
    – FelixIP
    Commented Oct 4, 2015 at 5:28
3
+25

You should use the "Group Analysis" tool to achieve your goal. This tools is a great tool from "spatial statistics" toolbox as @phloem pointed to. However you should fine tune the tool to adapt to your data and problem. I created a similar scenario like the one you posted and got the response close to your goal.

Hint: Using ArcGIS 10.2, when I ran the tool, it complained about the missing python package, "six". So make sure you have it installed first Link

Steps:

  1. Add a field to you polygon class to hold a unique value
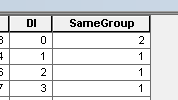
  2. Add another field of type Short with the name e.g. "SameGroup"
  3. you field calculator to assign 1 to this field for all rows. just change one row to 2. Added Field

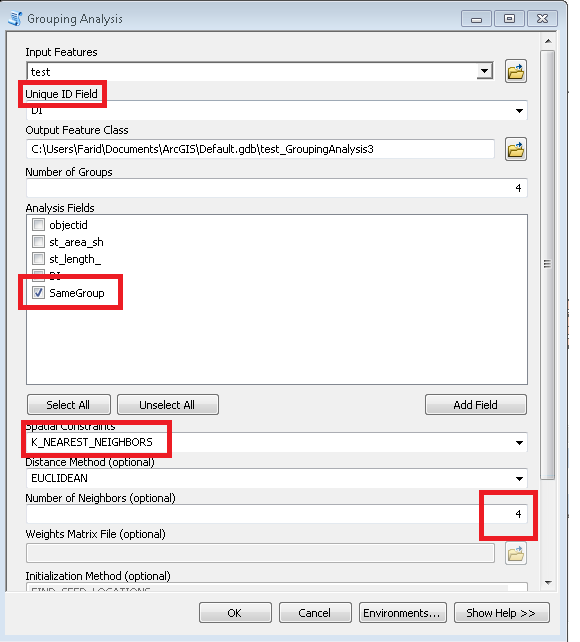
  4. Set "Group Analysis" tool parameters like this: Group Analysis

try to change "Number of Neighbours" parameter to suit you need.

Result Snapshots:

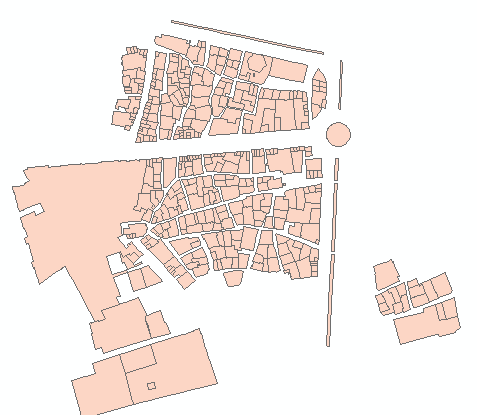
Sample Input Polygons

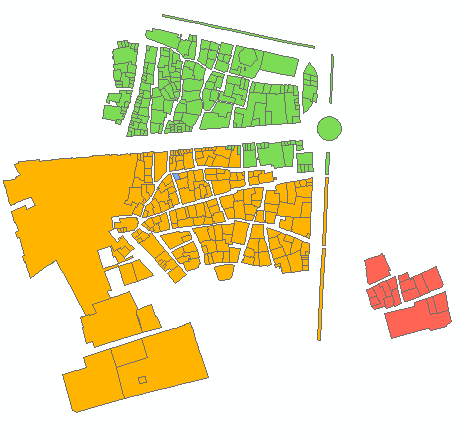
Result of the Group Analysis

3
  • 2
    I looked into Group Analysis prior. It deals with spatial, but not count as far as I can tell. All my experience from reading documentation, looking at your example, and performing my own tests don't allow to group by equal numbers of polygons. Commented Jan 29, 2015 at 0:25
  • Why do you need to make equal (off-course for the agents)? But If we add that constraint then why to cluster(group) the data based on spatial relationship!? Commented Jan 29, 2015 at 2:05
  • 1
    Because the boss says so. Also, minimize travel time. Commented Jan 29, 2015 at 2:06
1

basically you want an equal size clustering method, so you could search with this key words on the web. For me, there is a good answer on stats.SE with a Python implementation in one of the answers. If you are familiar with arcpy you should be able to use it with your data.

You first need to compute the X and Y of your polygons' centroids, then you can enter these coordinates in the script and update their attribute table using a .da cursor.

1
  • The link your provide seems like it's on the right track, but it's basically in a language I don't understand. For the script I don't know what the inputs are and can't decipher any of the coding to understand exactly what's happening. There's very little explanation. Commented Jan 29, 2015 at 23:02
0

Hi there i had a similar issue as this before , so i had given it some though , never got another started with , it but just on the thoery side i was thinking

INPUT SHAPE

Input shape

i was thinking you could create a fishnet on the input shape

fishnet fishnet with an intersect of you input shape would then
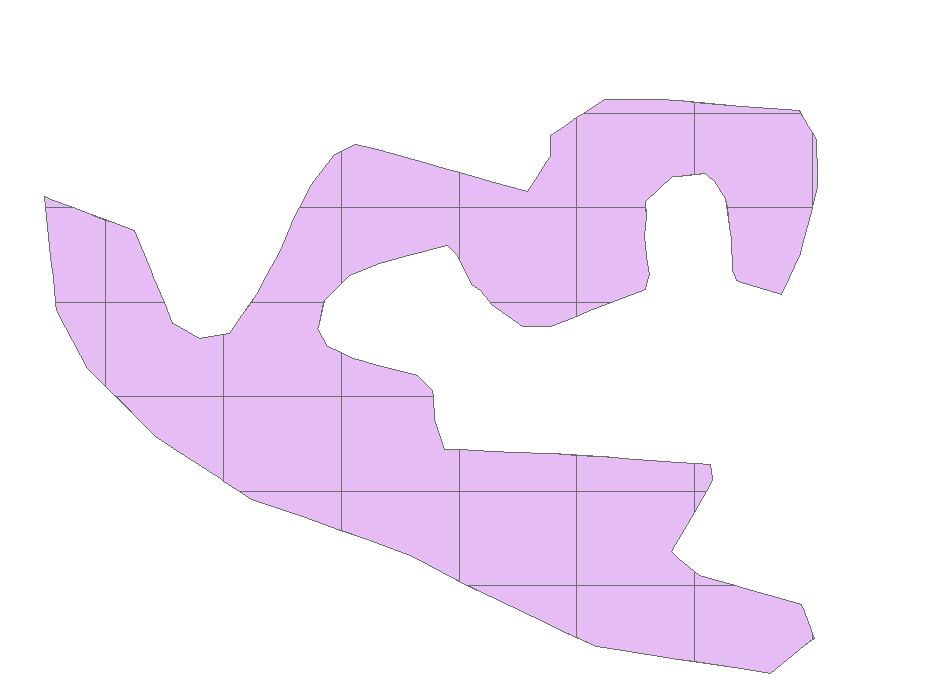
input into area

You can then calculate the area of these parcels inside the newly processed polygon

At the start of your script the area input polygon / nth amount of equal sizes wanted

You would then need a way of relating the parcels so they aware of the ones that are bordered.

Then you could go through a row cursor of summing up the parcels

Rules being

*It shares a border to the last one summer *It has not been summed *Once it goes over the value calculated as the equal area, it would step back and this would be a group * Process would start over again * last group could be the sum of the parcels left over

i think establishing the relationship bewteen the parcels might be the tricky thing but once this is done i think it could be possible to automise it

2
  • I'm afraid I don't understand what this has to do with my issue. What does cutting up a polygon with a fish net have to do with grouping polygons spatially and by equal numbers? You seem focused on area, not count. Area (size) of parcel polygons is not a factor. Regardless of how big or small a parcel is, it's still just one property owner to talk to. See my example where red is a rural area and spreads wide, while orange is urban and so covers a much smaller total area. Commented Jan 29, 2015 at 19:49
  • hi there you , sorry i total mis read your question. i think radouxju post could be the way to go , but the link goes a bit over my head. Turning the polygons into points seems logical and then grouping these. There might be a way introducing the road system as the distance from the point to the road and next point might define the spatial element Commented Jan 29, 2015 at 22:45
0

I believe the extension you are looking for is Districting. It's usually used for elections but as well as for equal size franchise territories. (Size doesn't necessarily mean for area, it can be any demographics)

http://www.esri.com/software/arcgis/extensions/districting

http://help.arcgis.com/en/redistricting/pdf/Districting_for_ArcGIS_Help.pdf

0

This is my solution for point events. No guarantees it will always work...

  1. On your point event layer (call layer1) add columns for x (double), y (double), and uniqueid (long integer)
  2. Open attribute table for layer 1. Calculate x coordinate point for x, y coordinate point for y, and FID for unique id
  3. Execute Spatial Statistics Tool > Mapping Clusters > Grouping Analysis
    • set layer1 as input features
    • set uniqueid as Unique Field ID
    • Define number of groups (we'll say 10)
    • Select x and y for analysis fields
    • Choose "NO_SPATIAL_CONSTRAINT" for Spatial Constraints
    • Click OK
  4. Execute Spatial Statistics Tools > Measuring Geographic Distributions > Mean Center
    • Select Output from #3 as Input Features Class
    • Select SS_Group as Case Field
    • Click OK
  5. Open Network Analyst > Location Allocation Tool
    • Load output of #4 as facilities
    • Load layer1 as Demand Points
    • Open Attributes and set
      • Problem Type as Maximize Capacitated Coverage
      • Facilities to Choose as 10 (from #3 above)
      • Default Capacity as the total number of features in layer1 divided by facilities to choose rounded up (so if 145 features and 10 facilities/areas, set as 15)
      • Click OK
        • Solve
        • Your demand points should be more or less equally distributed into 10 geographic clusters
1
  • I'm stuck at step five of your method. I've checked out the Network Analyst extension and added the Network Analyst toolbar. But most of it is grayed out and I don't see "Location Allocation Tool". I'm using 10.1. Commented Jun 16, 2016 at 17:20
0

You will need to create a Network Dataset first using your streets. I have tried this proposed method and have so far had better luck doing the same thing with Grouping (step 3) by itself, using X,Y coordinates and k-means for input fields (not perfect, but quicker and closer to what I am needing).

Your Answer

By clicking “Post Your Answer”, you agree to our terms of service and acknowledge you have read our privacy policy.

Not the answer you're looking for? Browse other questions tagged or ask your own question.