For a point data set with temperature data I have, I want to create their Thiessen Polygons in R. So far, the only algorithm I have found is that of Carson Farmer (http://carsonfarmer.com/2009/09/voronoi-polygons-with-r/). I would like to know if there is a ready to use function that creates Thiessn Polygons?
3 Answers
Thiessen polygons are Voronoi diagrams - there is a 'voronoi' package available in the CRAN archives (not the main repository), but the 'deldir' package does the same job.
require(deldir)

# Create some points
x <- c(32.5, 32.1, 33.5, 32.2, 33.0)
y <- c(-2.2, -3.3, -2.3, -2.9, -3.0)

# Calculate the Delaunay triangulation, then the tiles.
z <- deldir(x,y,rw=c(32.0,33.6,-3.4,-2.1))
w <- tile.list(z)

# Make a list of pretty colours, and use 'em to plot:
wcols <- topo.colors(5)
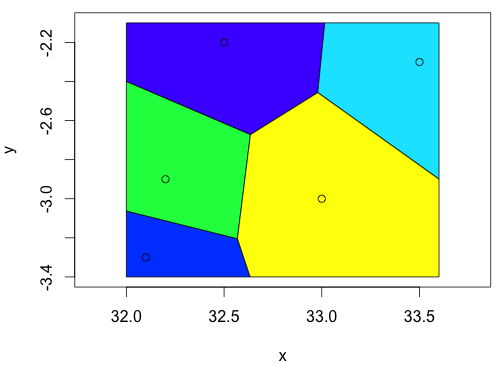
plot(w, fillcol=wcols, close=TRUE)

Now, the 'w' object is a 'tile list', not an sp object, but the tiles could be turned into a spatial object pretty easily, using the x / y components of the list:
> str(w[1])
List of 1
 $ :List of 5
  ..$ ptNum: int 1
  ..$ pt   : Named num [1:2] 32.5 -2.2
  .. ..- attr(*, "names")= chr [1:2] "x" "y"
  ..$ x    : num [1:5] 33 32 32 32.6 33
  ..$ y    : num [1:5] -2.1 -2.1 -2.4 -2.67 -2.46
  ..$ bp   : logi [1:5] TRUE TRUE TRUE FALSE FALSE
-
I had a script saved to create an sp object using a tesselation from the spatstat package. See here for your example points. I'm pretty sure spatstat just uses the same deldir library, but I'm lazy and couldn't figure out how to edit the functions to get them to work directly with the tile list from
deldirin a quick attempt.– Andy WCommented Feb 24, 2015 at 13:17 -
Thanks for the script - if I can get around to making it work with deldir's output I'll update here. Commented Mar 3, 2015 at 14:02
Alternatively, you could use dismo package. It accepts SpatialPoints* or matrix as input data.
library('dismo')
x <- c(32.5, 32.1, 33.5, 32.2, 33.0)
y <- c(-2.2, -3.3, -2.3, -2.9, -3.0)
points <- matrix(c(x,y), ncol=2)
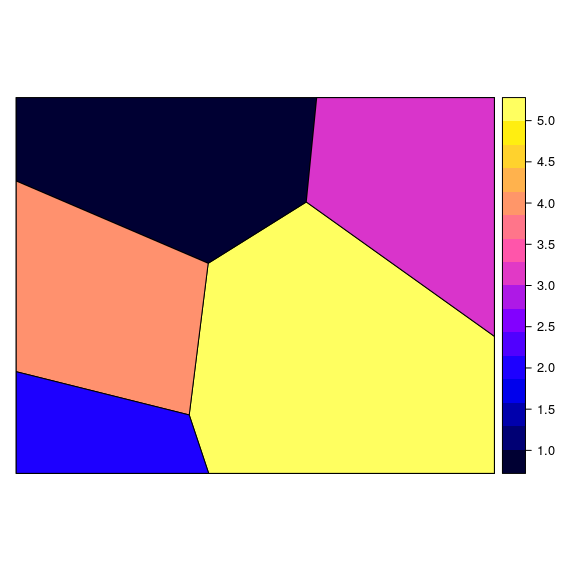
vor <- voronoi(points)
spplot(vor, "id")
Or, can make use of Simple Features for R. So, sf::st_voronoi() function. Below are examples inspired from this help page:
Simple voronoi grid example
library(sf)
#> Linking to GEOS 3.8.0, GDAL 3.0.4, PROJ 6.3.1

# generate some random points
set.seed(2020-05-27)
n <- 100
points <- runif(n) %>%
  matrix(ncol = 2) %>%
  st_multipoint()

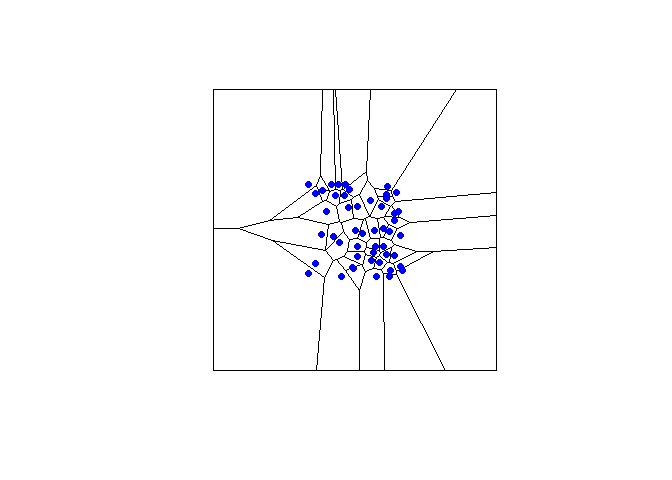
voronoi_grid <- st_voronoi(points)

plot(voronoi_grid, col = NA)
plot(points, add = TRUE, col = "blue", pch = 16)

Created on 2020-05-27 by the reprex package (v0.3.0)
Voronoi grid with color based on point property
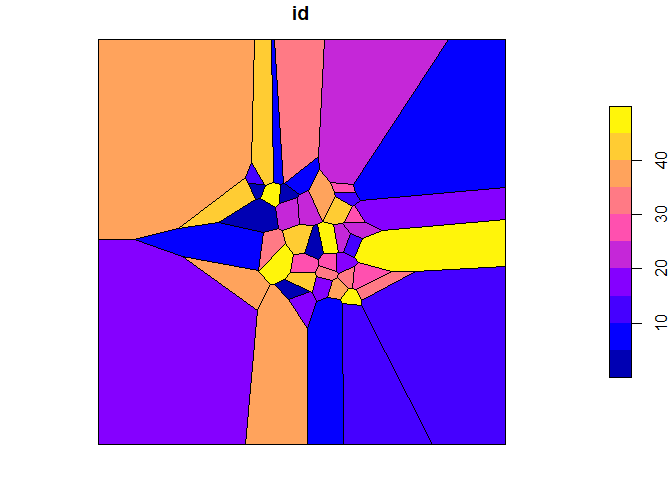
Here after generating the Voronoi polygons, we can intersect them with the points (that we used to generate the polygons). By doing so, we retrieve whatever point properties (features/columns/variables) that we can use for coloring.
library(sf)
#> Linking to GEOS 3.8.0, GDAL 3.0.4, PROJ 6.3.1

# generate random points
set.seed(2020-05-27)
n <- 100
points <- runif(n) %>% # generate a numeric vector of n random values
  matrix(ncol = 2) %>% # convert to matrix with 2 columns
  data.frame(id = 1:(n/2)) %>% # convert to data frame and add an id dummy column
  st_as_sf(coords = c("X1", "X2"))  # convert to spatial feature object

# compute Voronoi polygons
voronoi_grid <- points %>%
  st_geometry() %>%
  do.call(c, .) %>%
  st_voronoi() %>%
  st_collection_extract()

# match polygons to points to get column id for coloring
points$pols <- st_intersects(points, voronoi_grid) %>% unlist %>% voronoi_grid[.]
voronoi_grid_id <- st_set_geometry(points, "pols")["id"]

plot(voronoi_grid_id)

Created on 2020-05-27 by the reprex package (v0.3.0)

