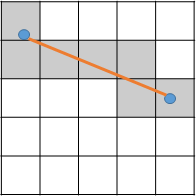
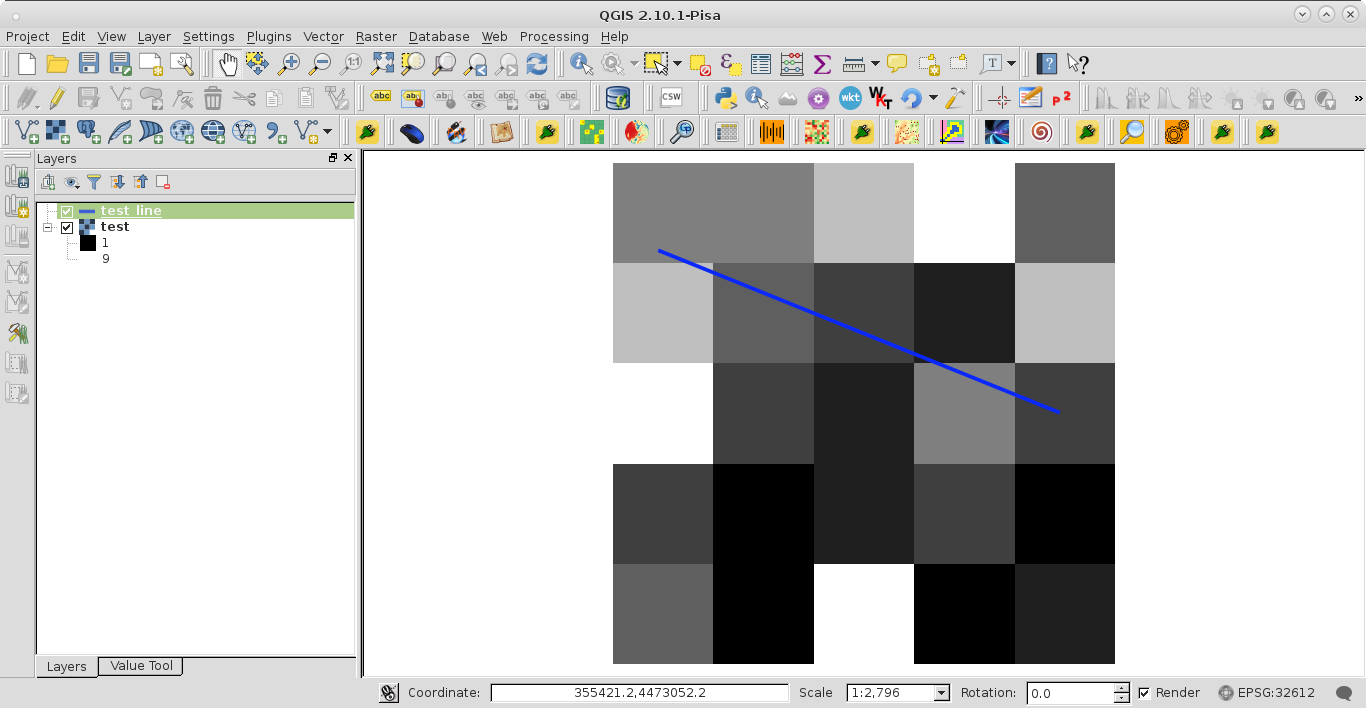
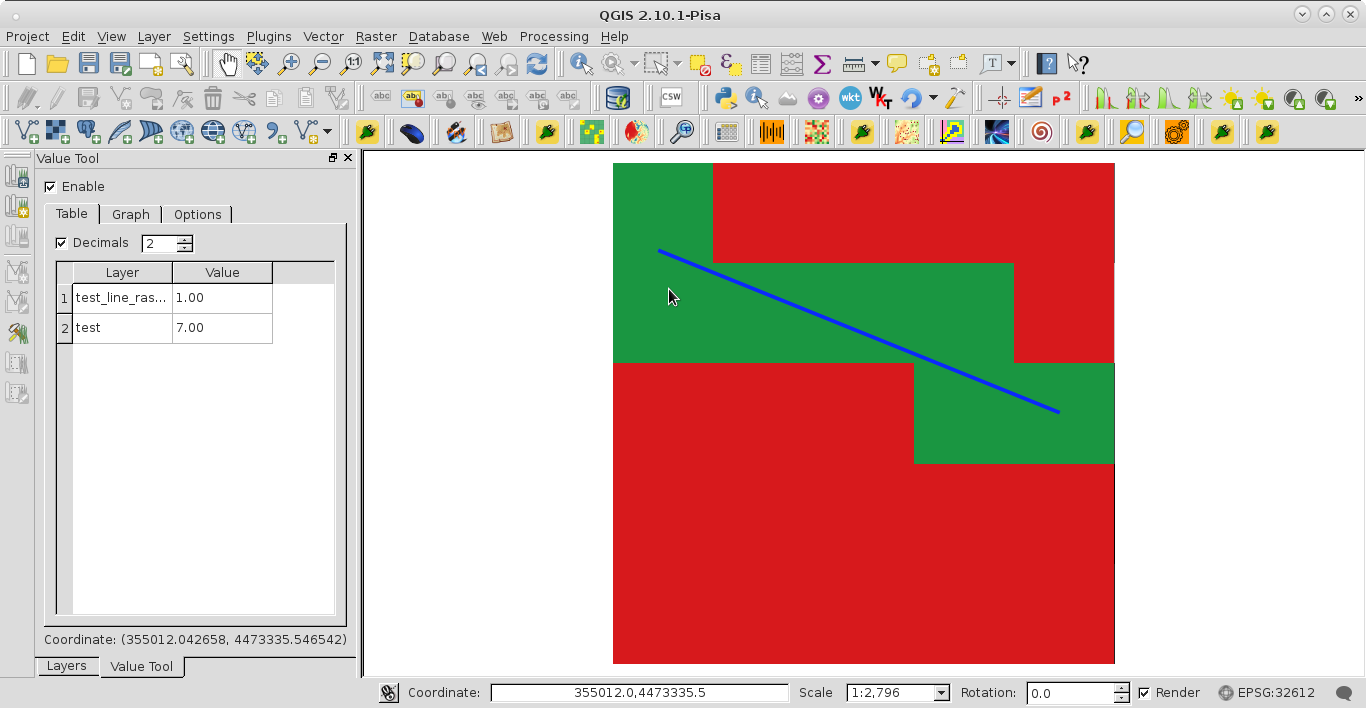
The idiomatic algorithm for extraction of pixels closest to a line is the Bresenham algorithm.
It may be present in underlying guts of libraries such as GDAL or others.
You will most probably find lots of implementations in various languages with some web search.
Quoting wikipedia:
Bresenham's line algorithm is a line drawing algorithm that determines the points of an n-dimensional raster that should be selected in order to form a close approximation to a straight line between two points [emphasis mine]. It is commonly used to draw line primitives in a bitmap image (e.g. on a computer screen), as it uses only integer addition, subtraction and bit shifting, all of which are very cheap operations in standard computer architectures. It is an incremental error algorithm. It is one of the earliest algorithms developed in the field of computer graphics [emphasis mine].
That being said, i discovered a few days ago this approach that looks quite elegent using GDAL. You can find the code on the author's github.
It uses pyproj projections + GDAL's Warp feature, in order to obtain a 1D array of elevations along the geodesic of 2 inputs positions.
The code is MIT licensed, but for the sake of stackexchange phisolophy, I'll paste it here. This is not mine, but kokoalberti's :
    #!/usr/bin/python3
    """
    Simple utility program to extract profiles from GDAL data sources using a
    two-point equidistanct projection.
    TODO:
    - Add option to include coordinates in output csv file. Currently it just
            records along-profile distance.
    """
    import argparse
    import sys

    from pyproj import CRS, Transformer
    from osgeo import gdal

    if __name__ == '__main__':
        # Parse command line args
        parser = argparse.ArgumentParser(description="Make profile with GDAL")
        parser.add_argument('src', metavar='SRC', help='GDAL data source')
        parser.add_argument('lon_1', metavar='LON_1', type=float, help='Longitude of start point')
        parser.add_argument('lat_1', metavar='LAT_1', type=float, help='Latitude of start point')
        parser.add_argument('lon_2', metavar='LON_2', type=float, help='Longitude of end point')
        parser.add_argument('lat_2', metavar='LAT_2', type=float, help='Latitude of end point')
        parser.add_argument('--width', type=int, default=100, help='Profile width (m)')
        parser.add_argument('--dist', type=int, default=100, help='Profile sampling distance (m)')
        parser.add_argument('--resample', default='near', help='Resampling method')
        parser.add_argument('--tif', default='', help='Output GTiff file')
        parser.add_argument('--csv', default='', help='Output CSV file')
        args = parser.parse_args()

        # Open/validate the source dataset
        ds = gdal.Open(args.src)
        if not ds:
            print("Could not open dataset.")
            sys.exit(1)

        # Set up coordinate transform
        proj_str = "+proj=tpeqd +lon_1={} +lat_1={} +lon_2={} +lat_2={}".format(args.lon_1, args.lat_1, args.lon_2, args.lat_2)
        tpeqd = CRS.from_proj4(proj_str)
        transformer = Transformer.from_crs(CRS.from_proj4("+proj=latlon"), tpeqd)

        # Transfor to tpeqd coordinates
        point_1 = transformer.transform(args.lon_1, args.lat_1)
        point_2 = transformer.transform(args.lon_2, args.lat_2)

        # Create an bounding box (minx, miny, maxx, maxy) in tpeqd coordinates
        bbox = (point_1[0], -(args.width*0.5), point_2[0], (args.width*0.5))

        # Calculate the number of samples in our profile.
        num_samples = int((point_2[0] - point_1[0]) / args.dist)
        print("Reading and warping data into profile swath...")

        # Warp it into dataset in tpeqd projection. If args.tif is empty GDAL will
        # interpret it as an in-memory dataset.
        format = 'GTiff' if args.tif else 'VRT'
        profile = gdal.Warp(args.tif, ds, dstSRS=proj_str, outputBounds=bbox,
                            height=1, width=num_samples, resampleAlg=args.resample,
                            format=format)

        # Extract the pixel values and write to an output file
        data = profile.GetRasterBand(1).ReadAsArray()
        print("Created {}m profile with {} samples.".format(args.dist*num_samples, num_samples))

        # Write csv output
        if args.csv:
            with open(args.csv, 'w') as f:
                f.write("dist,value\n")
                for (d, value) in enumerate(data[0,:]):
                    f.write("{},{}\n".format(d*args.dist, value))
            print("Saved as {}".format(args.csv))

        # Clean up
        profile = None
        ds = None
Last link which I do not know if it is worth it (paid content ?) on oreilly seems to rely on GDAL and Shapely to achieve same result, if someone has some feedback on this, feel free.


