23

Do any of the current open source GIS softwares support discontinous projection systems e.g. sinusoidal, dymaxion, butterfly, etc?

If not, are there any affordable commercial ones that do (affordable meaning < $150)?

Apparently it was a bad idea to lead with "sinusoidal", as that projection also has a single point non-interrupted form. The key word here is discontinuous or interrupted.

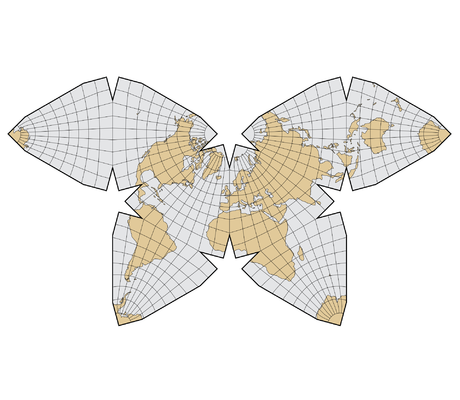
Cahill's 1909 butterfly map

12 Answers 12

11
+50

It's possible to construct something like the interrupted sinusoidal projection, and similar projections, by doing several (normal) sinusoidal projections and cutting & pasting them together. I'm not aware of a tool that does this (but I am not the person to ask about tools), so in the case that you have to resort to spit and glue...

  • If you look at a random example of the interrupted sinusoidal, each perfectly vertical meridian corresponds to a single sinusoidal projection.

  • For that example, you're looking at sinusoidals centered on longitudes: -160,-100,-60, ...

  • Then, cut and shift the parts to line up: The bottom left part is composed of longitudes -180..-100 and latitudes 0..-90, and projected with a center longitude of -160. The next part is longitudes -180..-40 and latitudes 0..90, projected w/ a center of -100. And so on (the example I linked was pretty intricate & there might be funny business going on in Russia; it doesn't look like a vanilla sinusoidal there).

If you're after a finished map, I would render it at to a nice high resolution georeferenced image and build the projection pieces by projecting it into each sinusoidal projection and then masking it. (Build the masks by projecting solid squares that cover the target lat/lon ranges for each piece.) If you're working with raw data, I would partition it into input pieces, taking care to split lines and polygons along any "cut" edges in the projection.

Hopefully this is a better-than-nothing answer. :)

It would be an interesting side project to automate this in a script (e.g. w/ gdalwarp)...

0
10

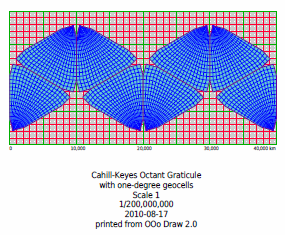
I have now uploaded a free and very detailed program set to generate the Cahill-Keyes Multi-scale Megamap with borders and one-degree geocell resolution at 1/1,000,000 or smaller scales. It uses the free OpenOffice.org Draw 3.0, and Perl. http://www.genekeyes.com/MEGAMAP-BETA-1/Megamap-Beta-1.html. (Check the link herein for many jpegs, pdf's, and free downloads as big as 40 MB.)

enter image description here

5

Here has a C program that can do coordinate transformation from (Lat,Long) to (X,Y) in the dymaxion projection. I'm not sure if this meets your criteria of open source, but it's as close as I've come.

I have not found anything to do a proper projection, but I did find this resource by Gene Keyes comparing Cahill's butterfly and Fuller's dymaxion projections, which is really nice. He has a perl script which can plot coordinates onto a dymaxion map. From there I found the basis for that script: the aforementioned site by R.W. Grey which has a C program that can do coordinate transformation and please see his note at the bottom of the page regarding terms of use for the code.

5

Jason Davies has produced a wide variety of interrupted projections for D3.js, such as the Waterman Butterfly:

enter image description here

Check out his site for the great work he and Mike Bostock have been doing on bringing interrupted projections to D3.

3

mapproj R package supports nice range of projections, sinusoidal among them.

You might also look at Jack van Wijk's Myriahedral Projections according to his paper:

All images were produced with a custom developed, integrated tool to define meshes and weights, and to calculate and render the results, running under MS Windows.

0
3

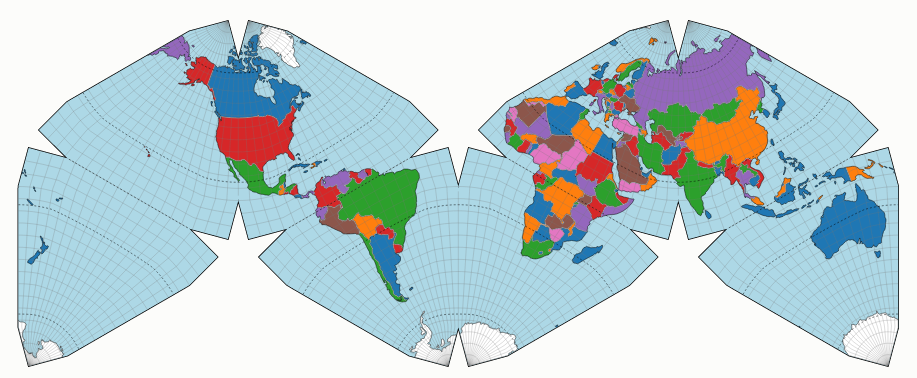
I long ago implemented Cahill-Keyes in D3.js following Gene Keyes' great documentation/code on his website. You can find it in this bl.ock

Here is a snapshot:

enter image description here

0
2

Simulating the Interrupted Goode Homolosine Projection With ArcInfo

http://proceedings.esri.com/library/userconf/proc98/proceed/to850/pap844/p844.htm

0
2

Take a look on GMT (Generic Mapping Tools), Main page on http://gmt.soest.hawaii.edu/ For illustrations, see http://gmt.soest.hawaii.edu/gmt/doc/gmt/pdf/GMT_Docs.pdf on page 121 of the documentation.

0
1

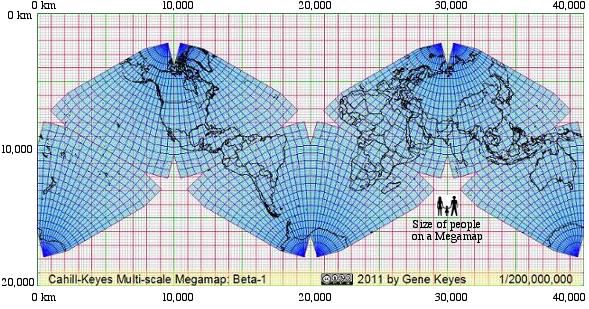
Gene Keyes and partner Mary Jo Graça have recently posted Cahill-Keyes Octant Graticule: Principles and Specifications with Perl programs and OpenOffice.org 2.0 macros for 1/1,000,000 Megamap under a creative commons share alike no commercial work license. Abstract "How a complete one-degree graticule of an eight-octant world map at 1/1,000,000 is made with Perl and macros in a free OpenOffice.org 2.0 vector-drawing program on a $300 Asus netbook. This is another installment of my drafting notes for the Cahill-Keyes "Real-World" map. It describes only the graticule, in intricate detail, both as hand or computer drawn archetypes. Inputting GIS data is the next challenge." The graphic in the question is from Gene's site. I didn't post about the perl & OO page until now as he hadn't gone public with the page yet.

thumbnail of the Open Office macro result

I've created mercurial source code repository of their work at http://bitbucket.org/maphew/cahill-keyes with the aim, eventually, of tackling the "getting into GIS" part. Though as of yet nothing has been done -- this is a corner of my desk project, progress will be slow. :)

1

As previously mentioned the C program here works well. Also available, here in javascript for openlayers.

I successfully used both, but had most success with the javascript version in adobe illustrator's scripting system. I took shape files and converted them to javascript objects, loaded them into illustrator and when drawing ran the points through the javascript projection code.

I produced a very interesting time zone map with this code.

I'm only just starting work with QGIS so i am not sure if there are any ways to have custom programatically projection like this, but I would be very interested to here about it.

0
1

I coded the sinusoidal interrupted projection in javascript, so it runs in web browser. You can check it here: http://www.winski.net/?page_id=12. I also support the USGS daisy petal projection.

You only need to pick your input image, sinusoidal interrupted projection from list of projections, number of gores, and click "project".

It is under BSD, so feel free to do anything you want with it :)

0

The Goode Homolosine projection can be achieved via CRS transform spTransform(obj,CRS('+proj=igh')) (where obj is your shapefile), and the resulting shape cropped by the CounterDomain.geojson available here (direct link).

The geojson file can be read by the same readOGR function (package rgdal) where you read your shapefile.

Your Answer

By clicking “Post Your Answer”, you agree to our terms of service and acknowledge you have read our privacy policy.

Not the answer you're looking for? Browse other questions tagged or ask your own question.