4

I have installed and followed the process to produce an elevation profile from the Route Profile plug-in in QGIS, but for some reason I am getting no profile to appear.

The grids are from OS Terrain50 and the route is a polyline shapefile. The tool version is 3.7.0 and I am using QGIS Lyon 2.12.0 on a Mac (El Capitan).

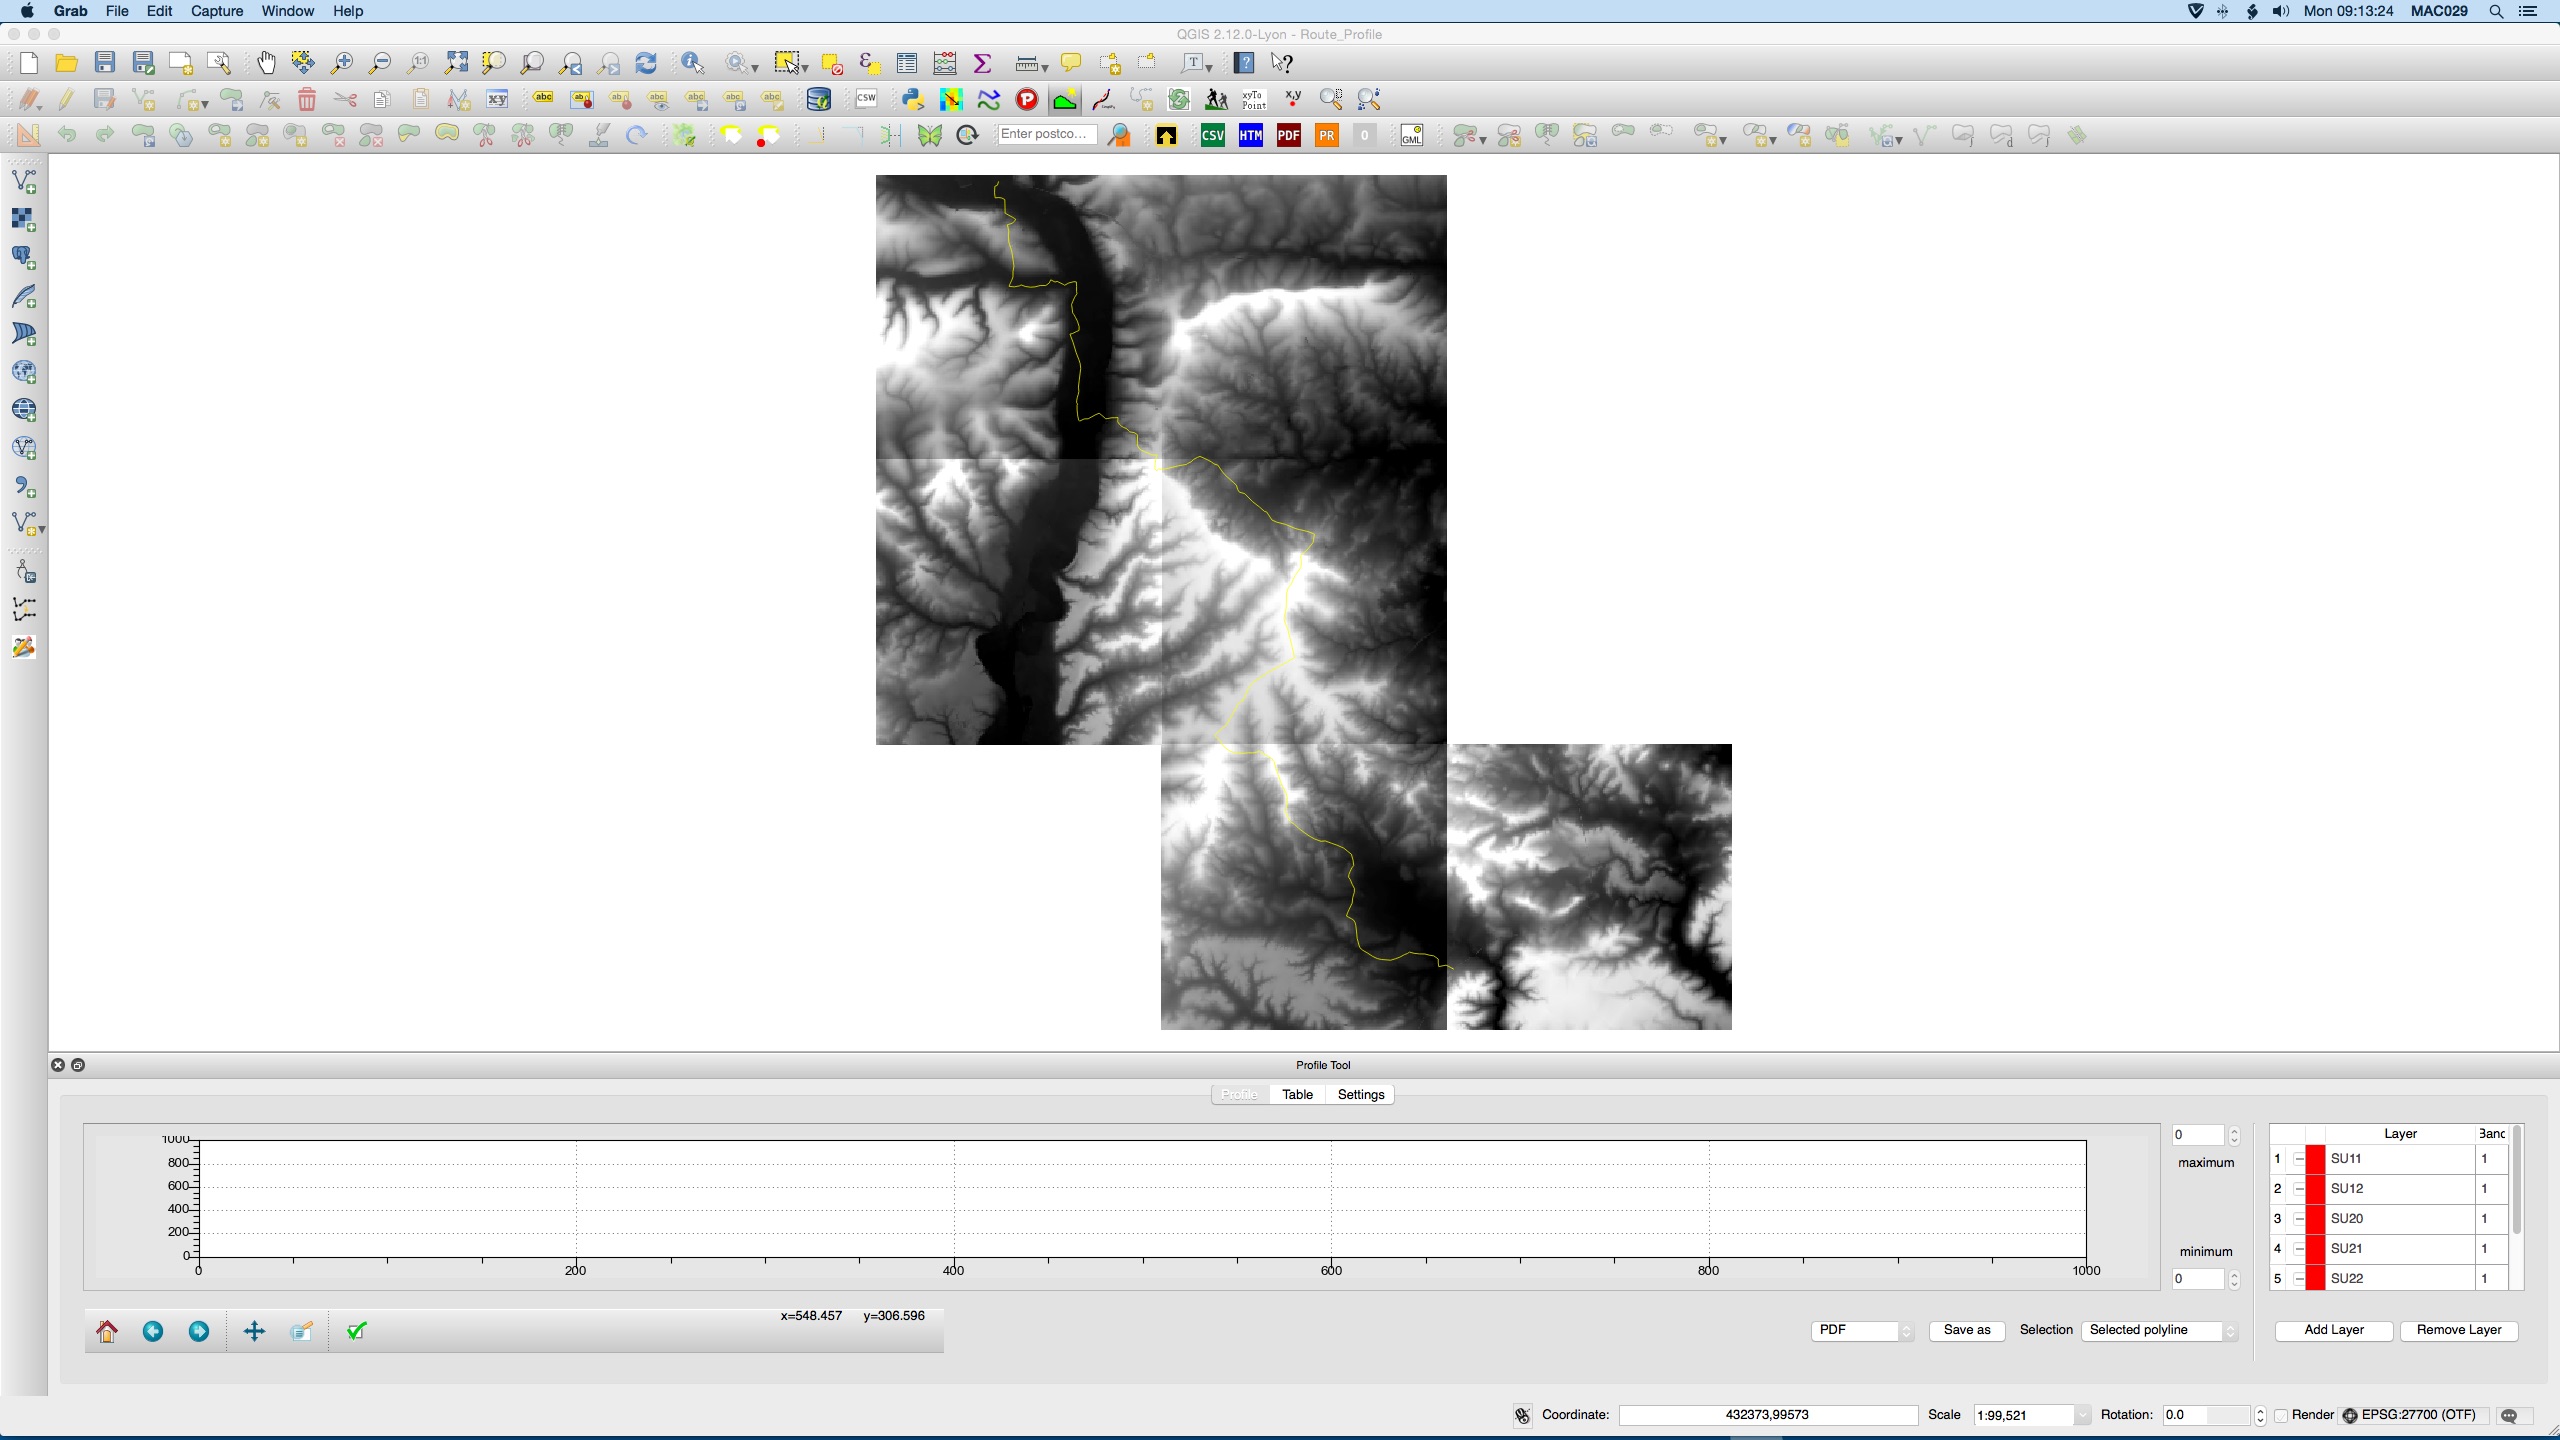
Profile Tool Screenshot

I have attached a screenshot of what is appearing.

I cannot see what I am doing wrong.

11
  • Does the profile appear when you save it as PDF or PNG?
    – Kersten
    Commented Jan 25, 2016 at 9:25
  • 1
    The min max of the graph is 0 and 0. Try setting the max to a non null value Commented Jan 25, 2016 at 9:25
  • No profile appears when I export it. Commented Jan 25, 2016 at 10:05
  • The min max boxes won't let me type anything in them. Commented Jan 25, 2016 at 10:06
  • are you sure that the layer is selected before you run the profile tool?
    – dmci
    Commented Jan 25, 2016 at 10:18

3 Answers 3

3

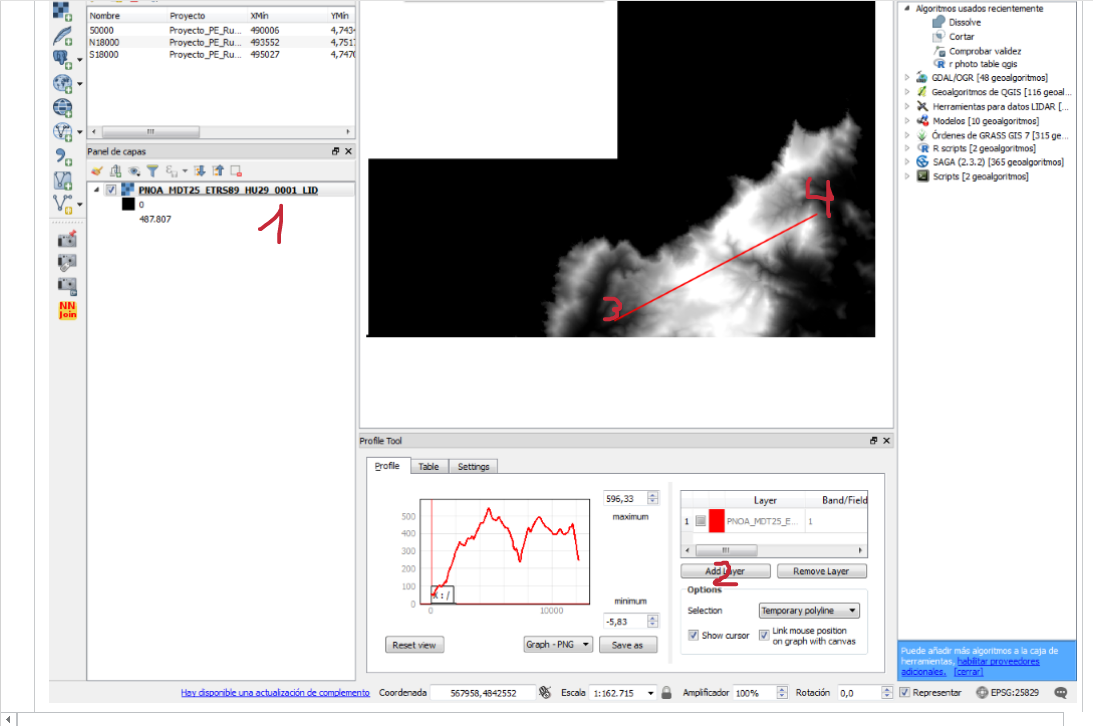
Here you have the screenshot with the sequence to get the profile of a line:

  1. Click on your dem file.
  2. Click on "Add layer" button.
  3. Click on the points between you want to see the profile (double click to finish the line).

In case you already have a line drawn (shape with a route or something like that) just change "Temporary polyline" to "Selected polyline" and click on the line in the map.

enter image description here

I hope it helps.

1

At 3.8.3, here's what works for me:

I have a raster DEM and a vector point shapefile (the point shapefile does not have elevation values in its attribute table). I want to create an elevation profile that follows the point shapefile, utilizing the underlying DEM elevation values:

  1. Start the Profile tool.
  2. Click the DEM in the QGIS Table of Contents.
  3. In the Profile Tool, click the Add Layer button. The highlighted DEM automatically appears in the tool.
  4. Click the vector point shapefile in the QGIS TOC.
  5. In the Profile Tool > Options pane, click the drop-down and select Selected Layer.
  6. Voila! The profile is displayed in the Tool's graph, as shown here:

enter image description here

Note: Resorting the shapefile points in a different order had no effect on the profile graph display. From this, it appears that the Profile Tool displays the elevation graph in the order that the points were originally digitized.

1
  • If you can't view the profile, it may be due to your vector layer is a multi-line. Try switching to "selected polyline" or merge the lines into a singular line. Commented Dec 15, 2023 at 14:57
1

Its also important to remember that if you have clicked outside from the Profiler plugin, and did something else in QGIS, you click again the icon of the Profiler plugin to reactive it. Otherwise, it won't react to you choosing the Temp polyline, Selected polyline, or Selected layer.

After choosing the plugin again, you can continue working with the selections.

Your Answer

By clicking “Post Your Answer”, you agree to our terms of service and acknowledge you have read our privacy policy.

Not the answer you're looking for? Browse other questions tagged or ask your own question.