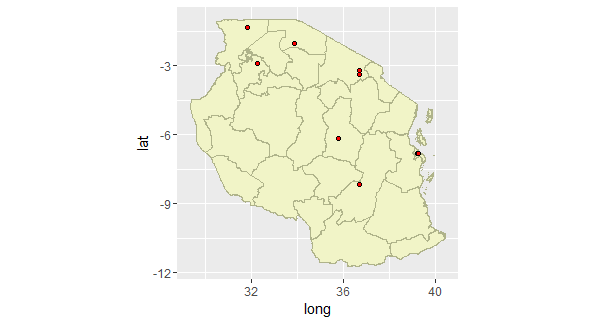
Here's some mock code to go along with my problem:
#read in libraries
library(ggmap)
library(sp)
library(raster)
library(ggplot2)

#read in country shapefile, project, fortify for mapping with ggplot
tz <- getData('GADM', country = "TZA", level = 1)
tz.prj <- spTransform(tz, CRS("+proj=longlat +datum=WGS84 +no_defs"))
tz <- fortify(tz.prj)

#create dummy data frame
lon <- c(36.68299, 36.66667, 31.80501, 33.87462, 35.75161,
         32.23135, 39.20833, 36.68173, 39.26093)
lat <- c(-3.386925, -3.216667, -1.329641, -2.018532, -6.162959,
         -2.885038, -6.792354, -8.139894, -6.822502)
tz.c <- data.frame(lon, lat)


#plot
ggplot() + geom_polygon(data = tz.prj,
                        aes(long, lat, group = group),
                        fill = "#f1f4c7",
                        color = "#afb38a") +
  geom_point(data = tz.c,
             aes(lon, lat),
             pch  = 21,
             color = "black",
             bg = "red") +
  coord_equal()
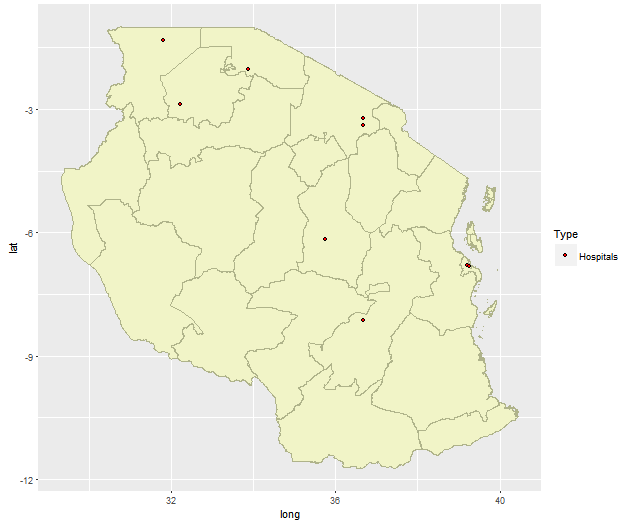
I want my legend to include the red dots from geom_point to define what they are (let's just say hospitals for this example). While my country outline is a solid color right now, it will eventually be symbolized in some other way with the hospital points on top of it, so I'd like to include all legend items in my legend.
I did some searching and found that in order to use show.legend = TRUE with geom_point, you have to plot everything within aes(). When I try to do this, it gives me the error: Error: A continuous variable can not be mapped to shape.
I converted my lat and lon to factors to try to quell this issue to no avail. So, how do I work with this data so that I can plot it to look the same as the image I've provided while also being able to plot/define the legend?


