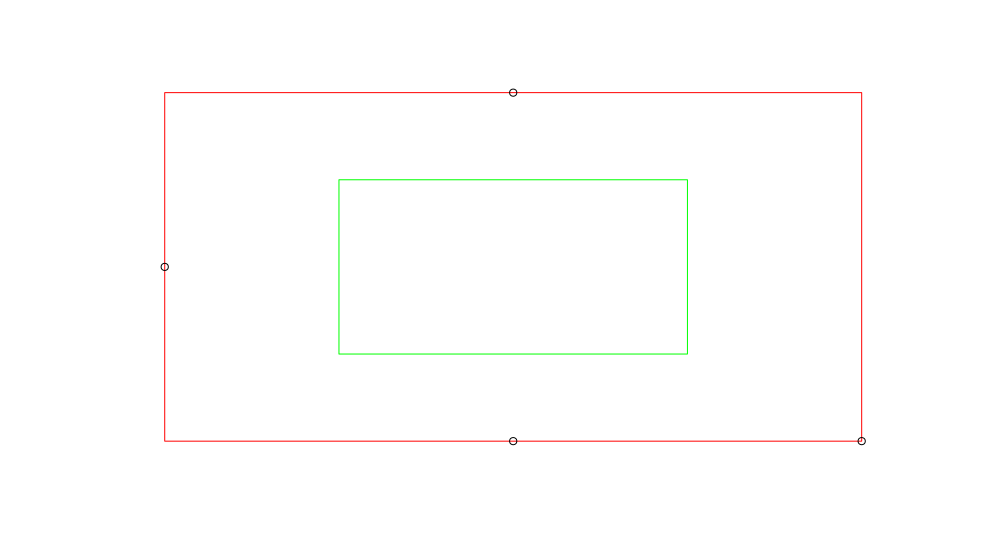
I have two sf-objects that are polygons and one that is a layer of points. The attributes (columns) don't really matter for quick visualization purposes. I just want to make a basic legend and give them different filling colors and maybe a custom name. Something like:
black -- "houses" green -- "inner city" red -- "outer city"
My code example:
library(sf)

# make multipoints
mp_matrix = rbind(c(5, 2), c(1, 3), c(3, 4), c(3, 2))
mp = st_multipoint(mp_matrix)
mp_sfc = st_sfc(mp)

# make outer poly
bbox = st_bbox(mp_sfc)
outer_poly = st_make_grid(bbox, n = 1)

# make inner poly
polygon = rbind(c(2,2.5), c(4,2.5), c(4, 3.5), c(2, 3.5), c(2,2.5))
poly_list = list(polygon)
poly = st_polygon(poly_list)
inner_poly = st_sfc(poly)

# plot all
plot(outer_poly, border = "red")
plot(inner_poly, add = T, border = "green")
plot(mp_sfc, add = T, col = "black")
produces the following plot. And all I want is just a really basic legend to the side with the colors and a self chosen name. I think that'd be really helpful for me for some future quick plots when ggplot, tmap or mapview is just too much. Maybe it's even easier with them and I just dont know.

