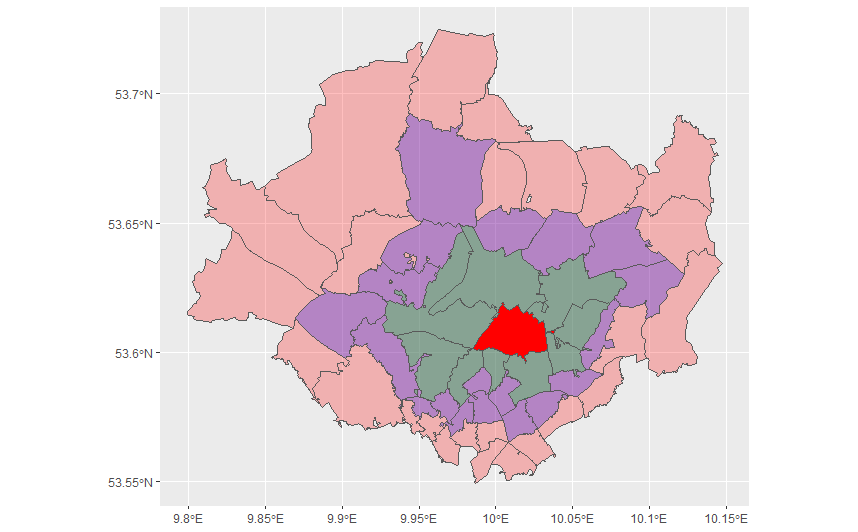
I wanted to make a simple plot of four sf-objects which don't contain much more than the sfc-column and some postal-code information.
The sf-objects have the names level 1-4 and plz. What I would like to have is a simple legend next to my map just showing the names of the objects (level 1-4) and plz and their matching colours.
It seems like a task which would be so easy in any desktop-gis, but I'd really like to do it in R. My code so far looks like this and produced the follwing figure.
ggplot() +
  geom_sf(data = level3, fill = fil.a) +
  geom_sf(data = level2, fill = fil.b) +
  geom_sf(data = level1, fill = fil.c) +
  geom_sf(data = plz, fill = "red") +
  coord_sf()

