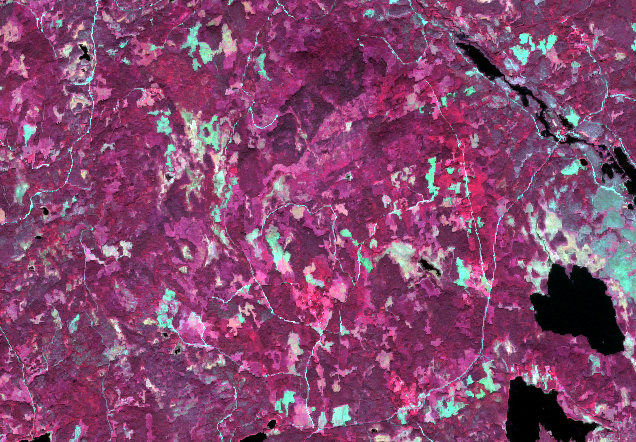
I'm publishing raster data (3 band geotiff) with Geoserver (for the first time). When i look at the unpublished raster data in QGIS im seeing:

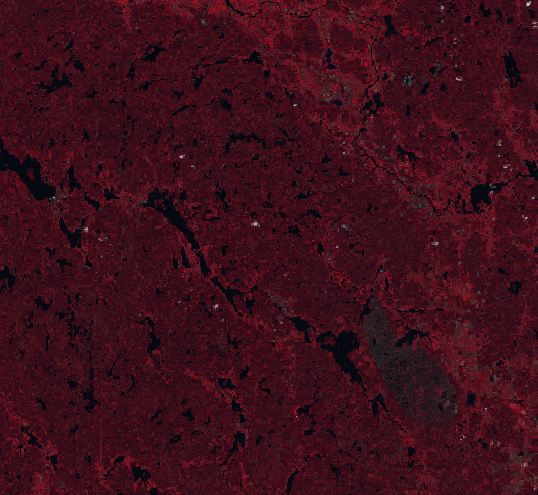
But when i look at the published WMS it appear very dark:

When i zoom in close it lightens a bit.
What do i need to do to make the WMS look more like when i watch the raster in QGIS?
gdal info output:
Driver: GTiff/GeoTIFF
Files: /home/bera/Geodata/Sentinel-2/20150819/2.tif
       /home/bera/Geodata/Sentinel-2/20150819/2.tif.aux.xml
Size is 10980, 10980
Coordinate System is:
PROJCS["WGS 84 / UTM zone 32N",
    GEOGCS["WGS 84",
        DATUM["WGS_1984",
            SPHEROID["WGS 84",6378137,298.257223563,
                AUTHORITY["EPSG","7030"]],
            AUTHORITY["EPSG","6326"]],
        PRIMEM["Greenwich",0],
        UNIT["degree",0.0174532925199433],
        AUTHORITY["EPSG","4326"]],
    PROJECTION["Transverse_Mercator"],
    PARAMETER["latitude_of_origin",0],
    PARAMETER["central_meridian",9],
    PARAMETER["scale_factor",0.9996],
    PARAMETER["false_easting",500000],
    PARAMETER["false_northing",0],
    UNIT["metre",1,
        AUTHORITY["EPSG","9001"]],
    AUTHORITY["EPSG","32632"]]
Origin = (600000.000000000000000,6800040.000000000000000)
Pixel Size = (10.000000000000000,-10.000000000000000)
Metadata:
  AREA_OR_POINT=Area
Image Structure Metadata:
  INTERLEAVE=PIXEL
Corner Coordinates:
Upper Left  (  600000.000, 6800040.000) ( 10d52' 4.82"E, 61d19'17.77"N)
Lower Left  (  600000.000, 6690240.000) ( 10d48'41.04"E, 60d20'10.72"N)
Upper Right (  709800.000, 6800040.000) ( 12d54'53.65"E, 61d16'40.73"N)
Lower Right (  709800.000, 6690240.000) ( 12d47'47.56"E, 60d17'39.86"N)
Center      (  654900.000, 6745140.000) ( 11d50'51.77"E, 60d48'40.97"N)
Band 1 Block=10980x1 Type=UInt16, ColorInterp=Gray
  Min=125.000 Max=6507.000
  Minimum=125.000, Maximum=6507.000, Mean=2222.441, StdDev=735.814
  NoData Value=0
  Metadata:
    STATISTICS_MAXIMUM=6507
    STATISTICS_MEAN=2222,4410683233
    STATISTICS_MINIMUM=125
    STATISTICS_STDDEV=735,81396086526
Band 2 Block=10980x1 Type=UInt16, ColorInterp=Undefined
  Min=184.000 Max=3718.000
  Minimum=184.000, Maximum=3718.000, Mean=455.960, StdDev=161.904
  NoData Value=0
  Metadata:
    STATISTICS_MAXIMUM=3718
    STATISTICS_MEAN=455,95982458067
    STATISTICS_MINIMUM=184
    STATISTICS_STDDEV=161,90389249049
Band 3 Block=10980x1 Type=UInt16, ColorInterp=Undefined
  Min=397.000 Max=2867.000
  Minimum=397.000, Maximum=2867.000, Mean=705.941, StdDev=123.796
  NoData Value=0
  Metadata:
    STATISTICS_MAXIMUM=2867
    STATISTICS_MEAN=705,94109519
    STATISTICS_MINIMUM=397
    STATISTICS_STDDEV=123,79629499805
