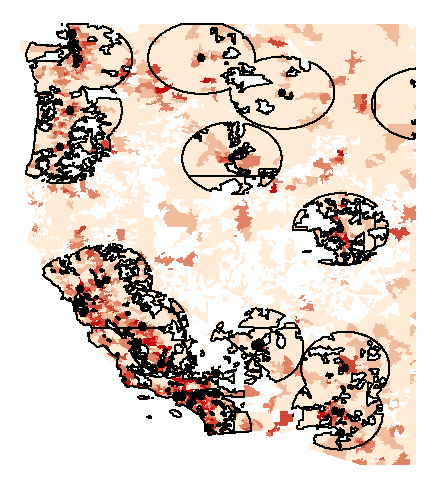
I am buffering, dissolving, and then clipping a 100 mile radius around each POI over a US map. I got the map from the US Census, and it represents every Zip Code Tabulation Area. Unfortunately, there are no ZCTAs in some parts of the country (anyone know why that is?). So, when I add my POI and then buffer, dissolve and clip, I get a splotchy result, and there are inexplicable lines running through the radii:
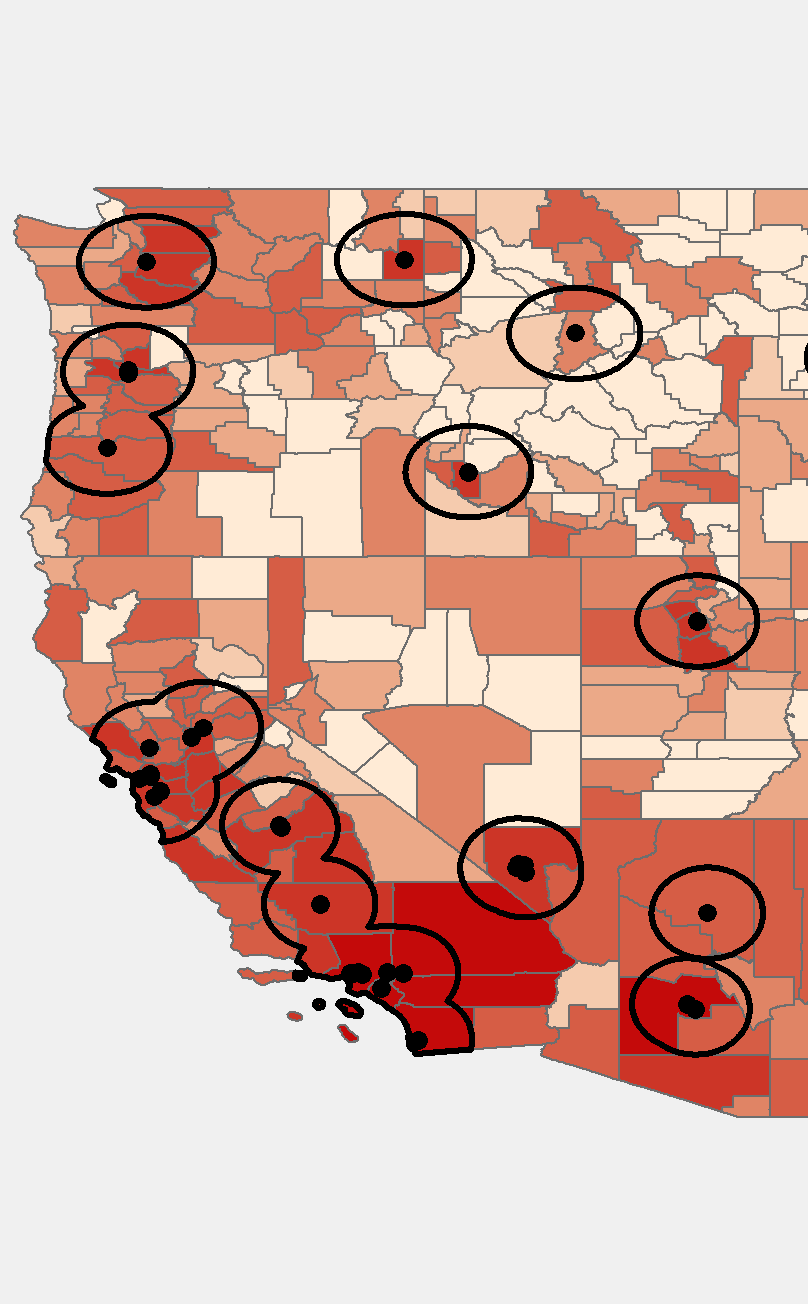
 Here's a trial I did using the county shapefile. The entire map is covered in counties, so I didn't have the above problem here. How can I get this kind of result for the ZCTA shapefile?

2 Answers
The reason why there are areas without ZCTA is explained on the US Census Bureau site:
For the 2010 Census, large water bodies and large unpopulated land areas do not have ZCTAs.
Now for your strange results, check these two bug descriptions that might apply:
As a possible workaround, you might try the Union tool with the ZCTAs and the buffered POI layers. Using this tool with 2 inputs is accessible to any license level.
You could create a dummy polygon for areas of no ZCTA. To make this start with a shape of all of the USA then use erase to remove all of the areas covered by ZCTAS. You can then load this into your original Feature Class - right click in the catalogue, load and navigate to your erased shapefile or FC.
Then re-run your clip.
