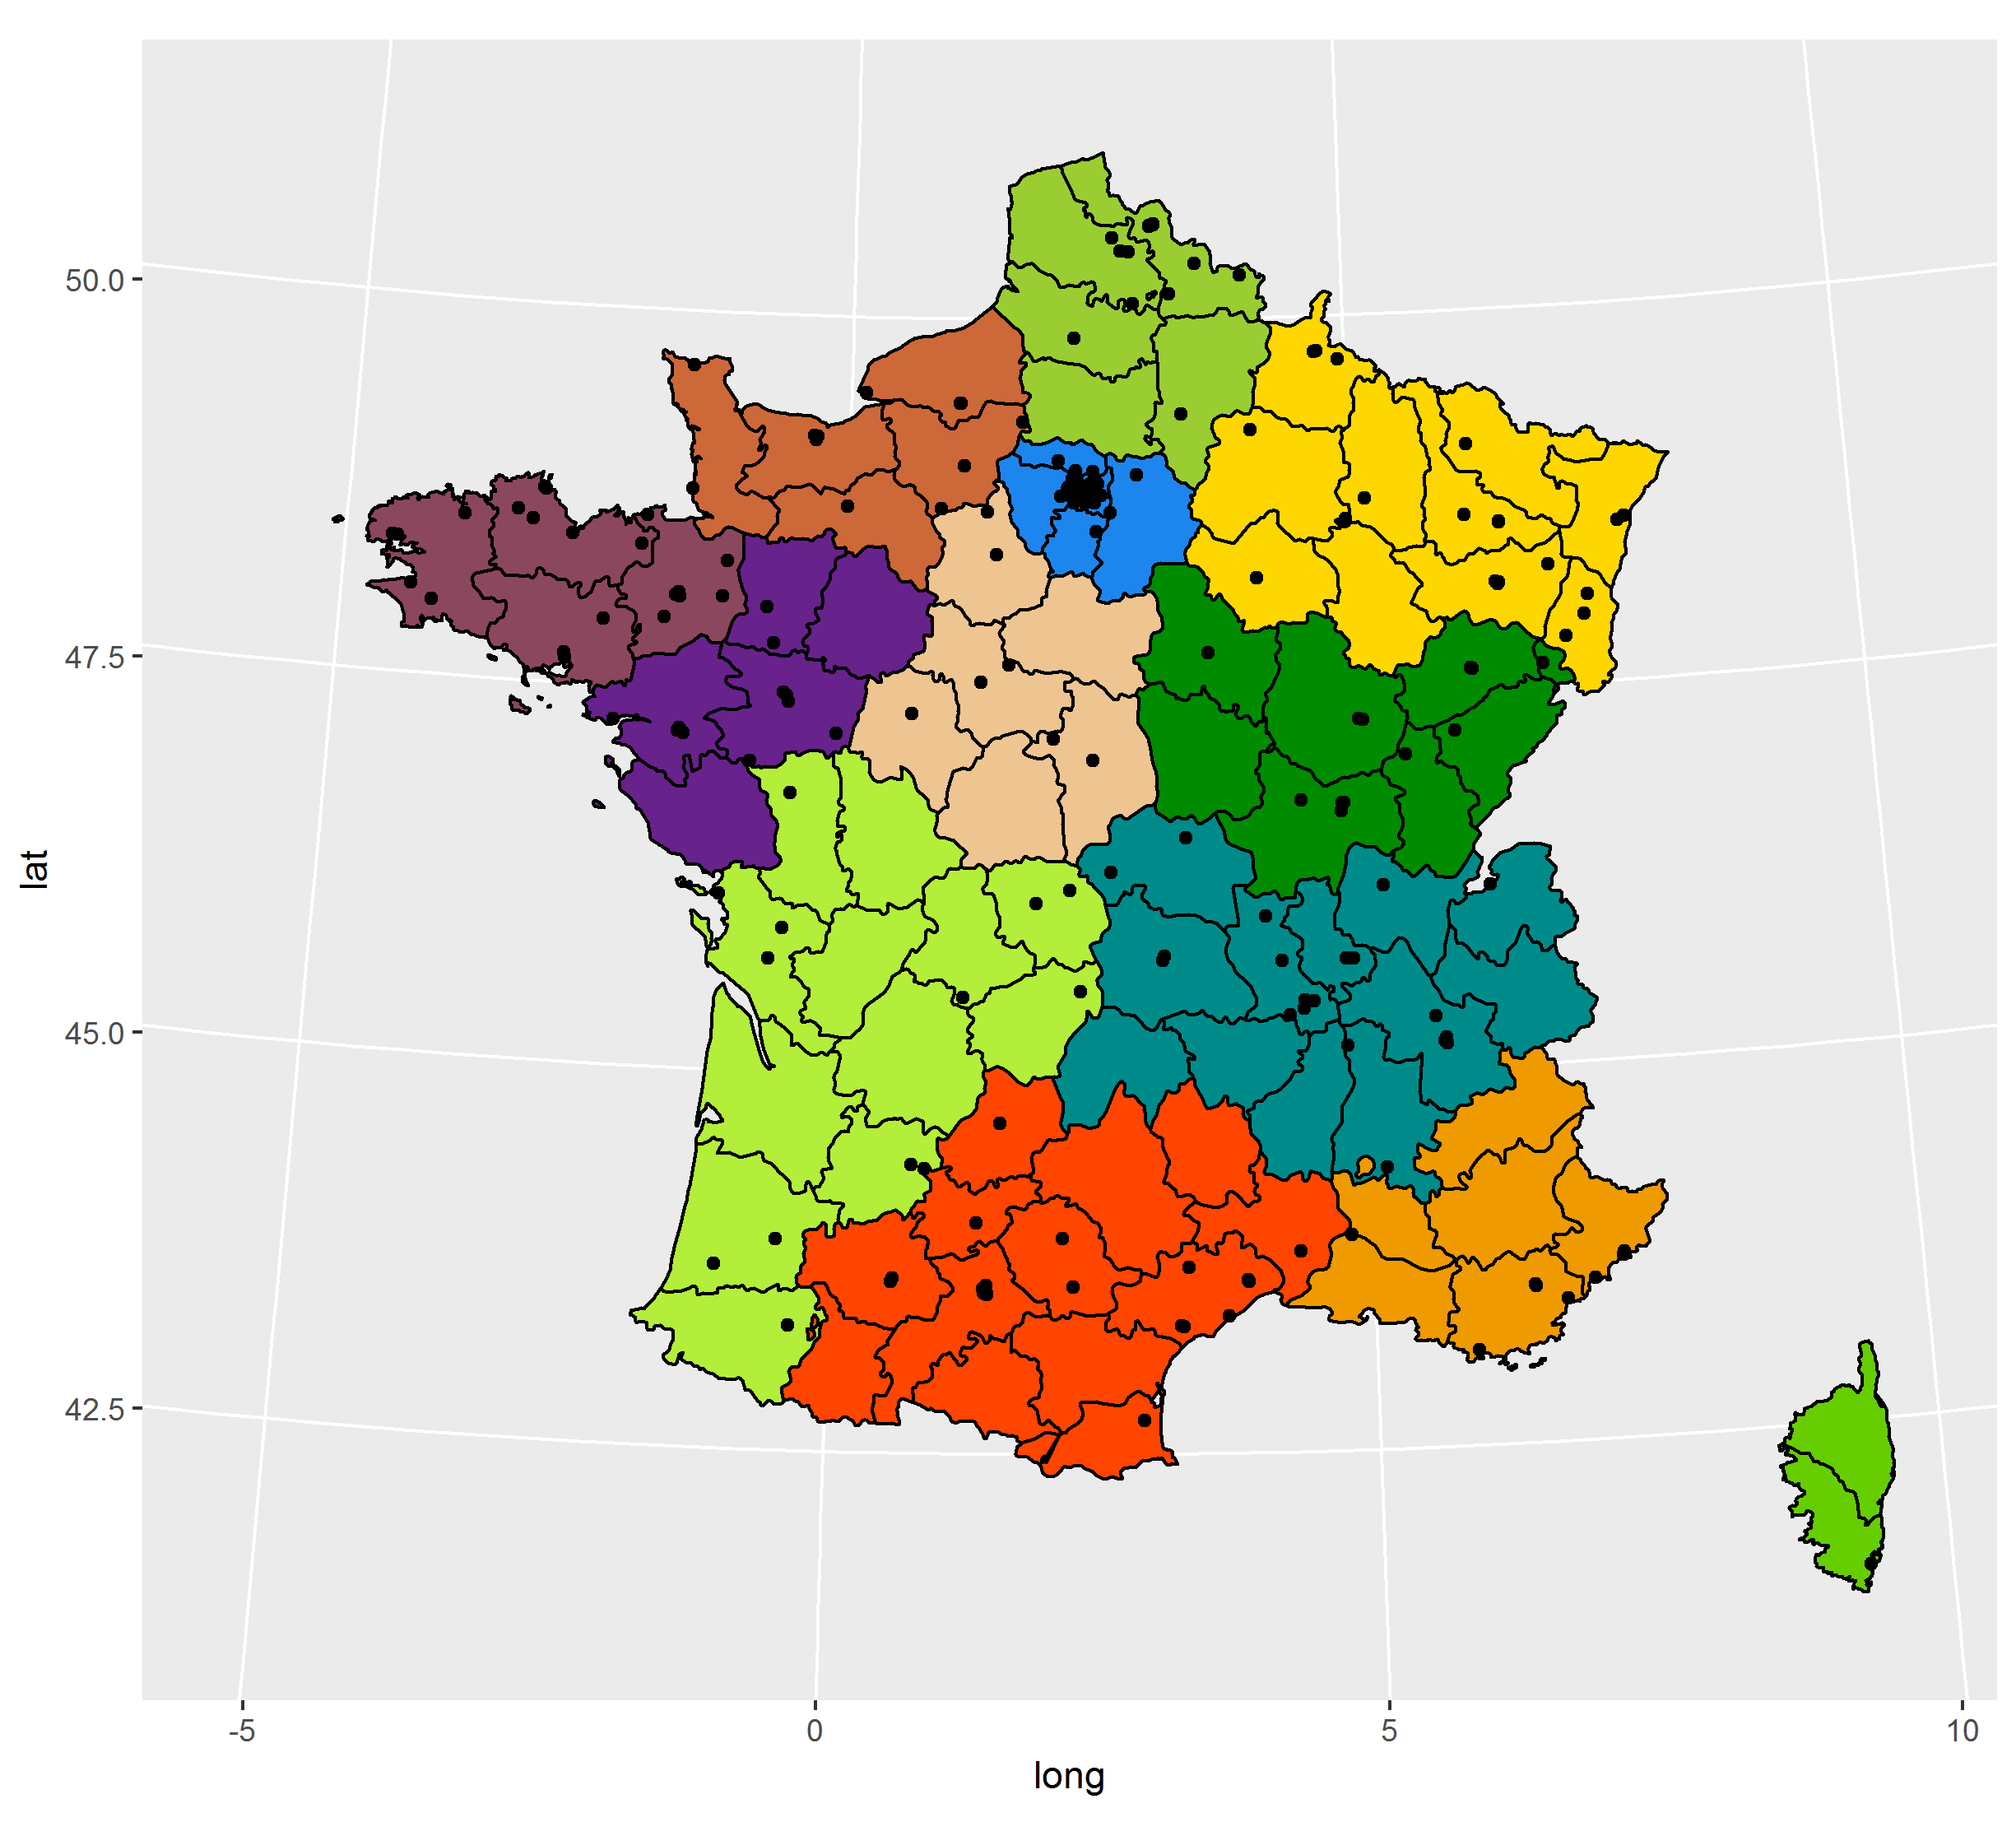
I'm searching for a way to plot some points for which I have the longitude and latitude (using Google Maps API) on a map created with centroids. I succeeded to do it by using functions such as map_data() and functions from the package ggplot2.
Results (just to show it really works) :
However I don't like the french departments datas given by map_data(), it's quite ambiguous but the nice thing is that their coordinates are given by longitude and latitude. (french departments are similar to counties)
What I would like to do is to use a shapefile from a site such as GEOFLA (here) that provides me datas in projection LAMBERT-93 to plot my map. However the shapefile only contains the coordinates of deparments centroids so, since I have, in one hand, coordinates given by longitude and latitude and, in the other hand, coordinates given by centroids, so I can't plot the points on my map since the coordinates are not in the same "unit".
That's what I get with summary() on the shapefile :
Object of class SpatialPolygonsDataFrame
Coordinates:
        min     max
x   99217.1 1242417
y 6049646.3 7110480
Is projected: TRUE
proj4string :
[+proj=lcc +lat_1=44 +lat_2=49 +lat_0=46.5 +lon_0=3 +x_0=700000 +y_0=6600000 +ellps=GRS80 +units=m
+no_defs]
Summary of map_data() (I show only the coordinates) :
      long               lat
 Min.   :-5.14209   Min.   :41.37
 1st Qu.: 0.05213   1st Qu.:44.41
 Median : 2.45500   Median :46.79
 Mean   : 2.45851   Mean   :46.47
 3rd Qu.: 4.97283   3rd Qu.:48.44
 Max.   : 9.56267   Max.   :51.10
This shows that the coordinates used are different.
I tried many things such as using proj4string(), sptransform() for example to get the same units but I didn't get what I wanted.
So how should I do to get the same units for my two differents types of coordinates ? Is there a way to get the longitude and latitude from the centroids of the shapefile or should I use a function (if it existed) that can transform my points with longitude and latitude into centroids ?
This is my first time using R for maps and polygons, projections etc. also so don't be surprised if I said some real stupid things.
Exemple of points I want to plot :
  centerid latitude longitude                                       adresse_complete
1   0121H1 46.22368  5.210819               900 Route de Paris, 01440 Viriat, France
2   0121H2 46.22368  5.210819               900 Route de Paris, 01440 Viriat, France
3   0218H3 49.37008  3.335127 46 Avenue du Général de Gaulle, 02200 Soissons, France
4   0303H1 46.34292  2.608996       18 Avenue du 8 Mai 1945, 03100 Montluçon, France
5   0303H2 46.34292  2.608996       18 Avenue du 8 Mai 1945, 03100 Montluçon, France
dput() from above :
structure(list(centerid = c("0121H1", "0121H2", "0218H3", "0303H1",
"0303H2"), latitude = c(46.2236804, 46.2236804, 49.3700842, 46.3429172,
46.3429172), longitude = c(5.2108193, 5.2108193, 3.335127, 2.6089958,
2.6089958), adresse_complete = c("900 Route de Paris, 01440 Viriat, France",
"900 Route de Paris, 01440 Viriat, France", "46 Avenue du Général de Gaulle, 02200 Soissons, France",
"18 Avenue du 8 Mai 1945, 03100 Montluçon, France", "18 Avenue du 8 Mai 1945, 03100 Montluçon, France"
)), .Names = c("centerid", "latitude", "longitude", "adresse_complete"
), row.names = c(NA, 5L), class = "data.frame")


spTransform(shp, CRS("init=epsg:4326"))will give you a long-lat version of the data from your shapefile, andrgdal::project(as.matrix(longlat), proj4string(shp))will convert the longlat values to the same projection as the shapefile data. Creating sp objects from scratch is pretty painful, but if you add more of the code you are using we can probably explain better. (It is confusing, sp and ggplot2 are essentially at-odds with each other, everything they do is different and there's no common language for how they work, though both are very sensible in their own way).spTransform(shp, CRS("init=epsg:4326"))is working for one point (Paris) :points(2.349,48.853,pch=20,col="red",cex=2)so do you think I will be able to plot the other points using ggplot2 functions such as geom_point for example ? By the way, could you explain what is"init=epsg:4326"? Anyway, thanks for the tip.spTransformcan work for any spatial object, so that you should first transform your matrix of coordinates into SpatialPoints and then you'll be able to project it.