1

The ONS (Office for National Statistics) in the UK makes available a large number of shapefiles based on geocoded statistical data sets and admin/demographic boundary shapefiles. These are deposited at http://geoportal.statistics.gov.uk. I'm aware that there are a range of ways to generalise and simplify polygons within shapefiles, but what I'd like to know is how, in particular, this is being done by ONS. I've experimented with several similar processes: using GRASS v.generalise / v.simplify and ogr2ogr -simplify but can't seem to replicate anything quite the same as this. In particular, I'm curious how this can be done to generate such small shapefiles. So, for example, on the "Combined Authorities (April 2015) Full Extent Boundaries in England" dataset, the shapefile is about 1.4MB, where as for "Combined Authorities (April 2015) Ultra Generalised Clipped Boundaries in England" the size is around 29kb.

The closest thing I could find to an explanation was:

  • Full resolution - extent of the realm (usually this is the Mean Low Water mark but in some cases boundaries extend beyond this to include off shore islands);
  • Full resolution - clipped to the coastline (Mean High Water mark);
  • Generalised (20m) - clipped to the coastline (Mean High Water mark);
  • Super generalised (200m) - clipped to the coastline (Mean High Water mark) and
  • Ultra generalised (500m) - clipped to the coastline (Mean High Water mark).

Perhaps there is an obvious mechanism for doing this that I'm missing because I haven't been searching in ArcGIS. I'd be glad for any suggestions as to the teechnical specifics of an industry "standard" approach to generalisation that might be in use here by ONS.

3
  • Have you asked ONS?
    – PolyGeo
    Commented Jul 10, 2017 at 20:32
  • good question. No. At least not yet, but was sort of hoping someone affiliated might be keeping an eye on this board! If there aren't any answers i'll chase it down directly and post here. Commented Jul 10, 2017 at 20:56
  • i suspect Ultra Generalised (500m) means that points are snapped to a 500m grid, then duplicate nodes are removed. That would explain the small sizes, that's a pretty course grid :) Not sure which tool they're using though.
    – Steven Kay
    Commented Jul 10, 2017 at 21:17

2 Answers 2

1

I've reached out to ONS and they were very helpful in sending along a tutorial describing their process. They make use of Feature Manipulation Engine by Safe Software This application has a "transformer" feature which does a Ramer–Douglas–Peucker style generalisation and exports back to a new ESRI format shapefile. The generalization tolerance is set at 20 (meters) for Generalised shapefiles (as indicated in the question). The files are then given a spatial index and geometry is checked and repaired as necessary (using the FME software). Super generalised and Ultra generalised follow the same process, though at 200m and 500m tolerance respectively. Because of the lack of fidelity, these last two require further manual correction particularly as their documentation notes, "round the coastline where rivers can be closed by overlapped boundaries. These errors have to be corrected, and rivers cut back to produce a less detailed appearance." A topology layer is manually created and then used to test for errors (with "cluster tolerance... set at 1 meter") and each polygon showing an error is manually resolved for overlaps etc.

1
  • hi, would you know if this information is published as an official document by ONS, thanks OS ? Commented Oct 8 at 9:50
0

Without seeing examples of the datasets it's hard to tell exactly what method was used (in fact it's hard even with seeing the data).

The most likely simplification method is some variant of the Ramer–Douglas–Peucker method.

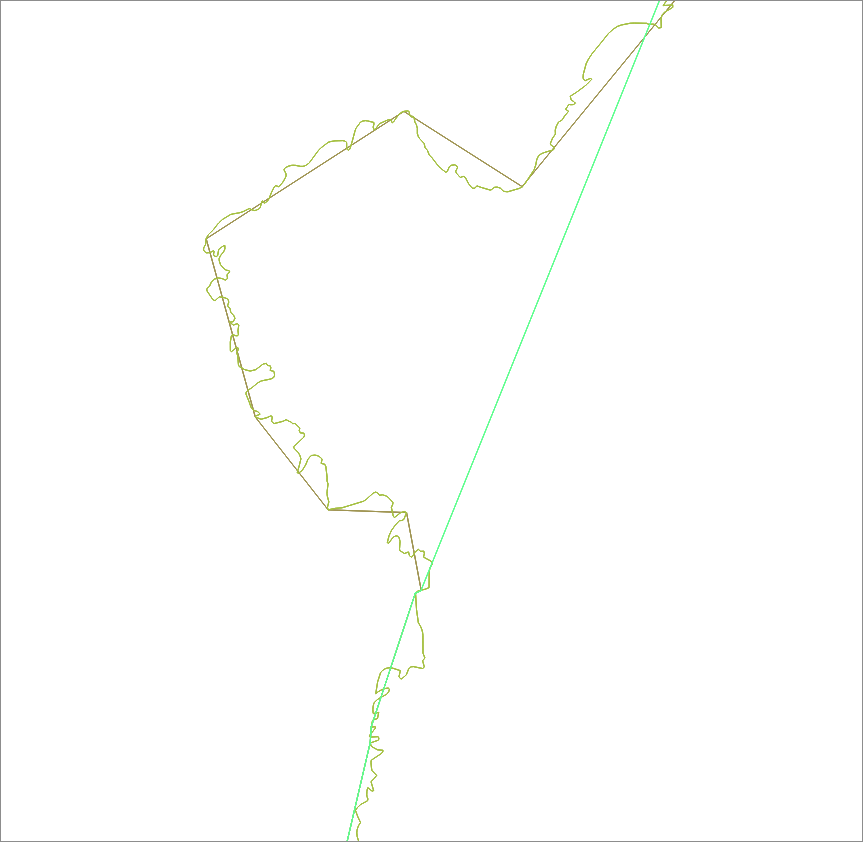
I've used the QGIS Vector simplification tool to generalise the OS BoundaryLine coast line for a variety of tolerances, which gives size savings of:

-rw-r--r-- 1 ian ian     7.7M Jul 11 09:34 1kmsimplecoast.shp
-rw-r--r-- 1 ian ian     9.8M Jul 11 09:34 100msimplecoast.shp    
-rw-r--r-- 1 ian ian     135M Jul 11 09:34 basecoast.shp

But you are losing quality and accuracy with each increase in tolerance.

enter image description here

1
  • Nice guess - as you'll see from my post below you were correct! PS, using QGIS 2.8.2 here and I don't see a "vector simplification tool" - has this been renamed to "Simplify geometries" or perhaps is it a plugin? Commented Jul 13, 2017 at 11:54

Your Answer

By clicking “Post Your Answer”, you agree to our terms of service and acknowledge you have read our privacy policy.

Not the answer you're looking for? Browse other questions tagged or ask your own question.