6

I have read the following two posts related to my question; however, my problem is slightly different and I'm having a hard time solving it.

  1. Finding if two polygons Intersect in python?
  2. Getting intersection of circles using shapely?

I have an image with irregular shapes such as these: enter image description here
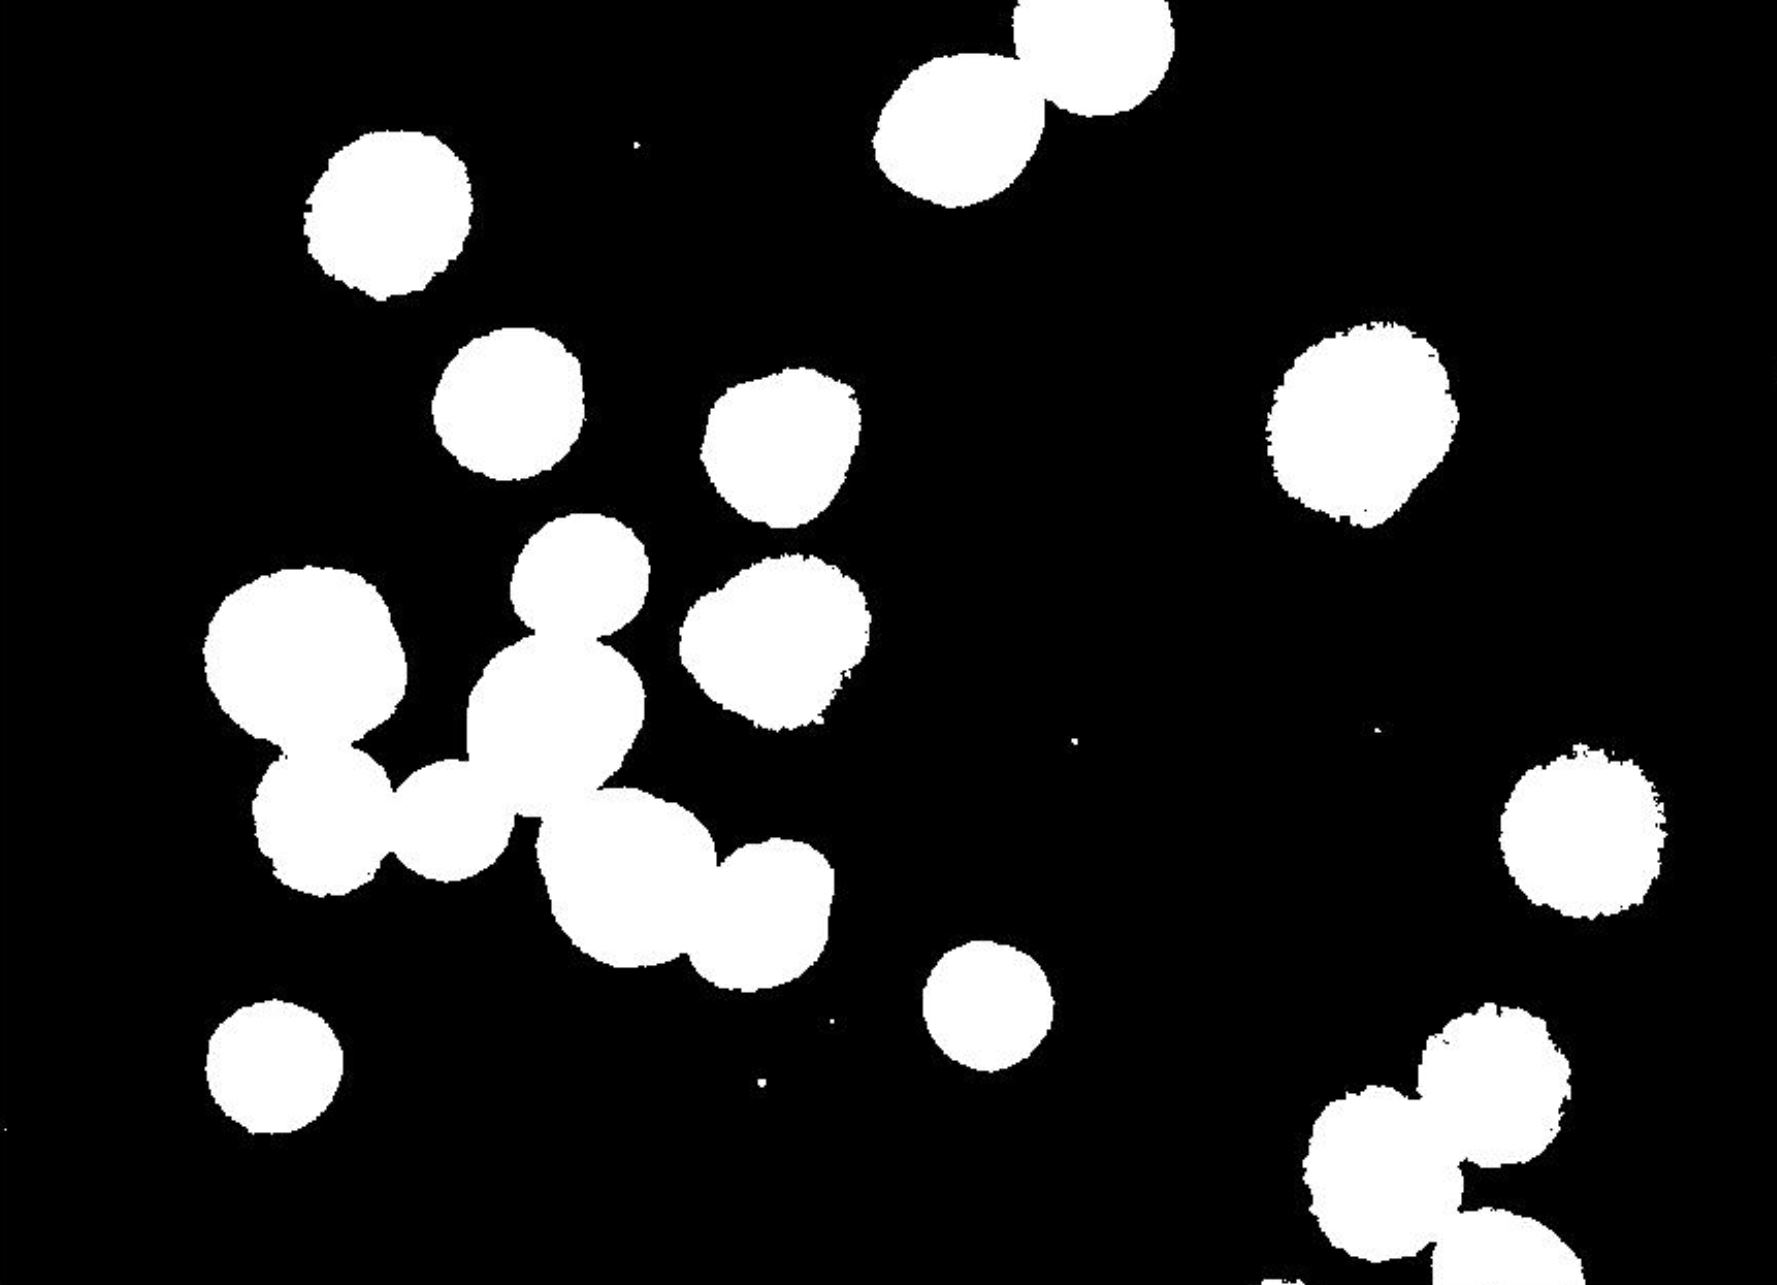
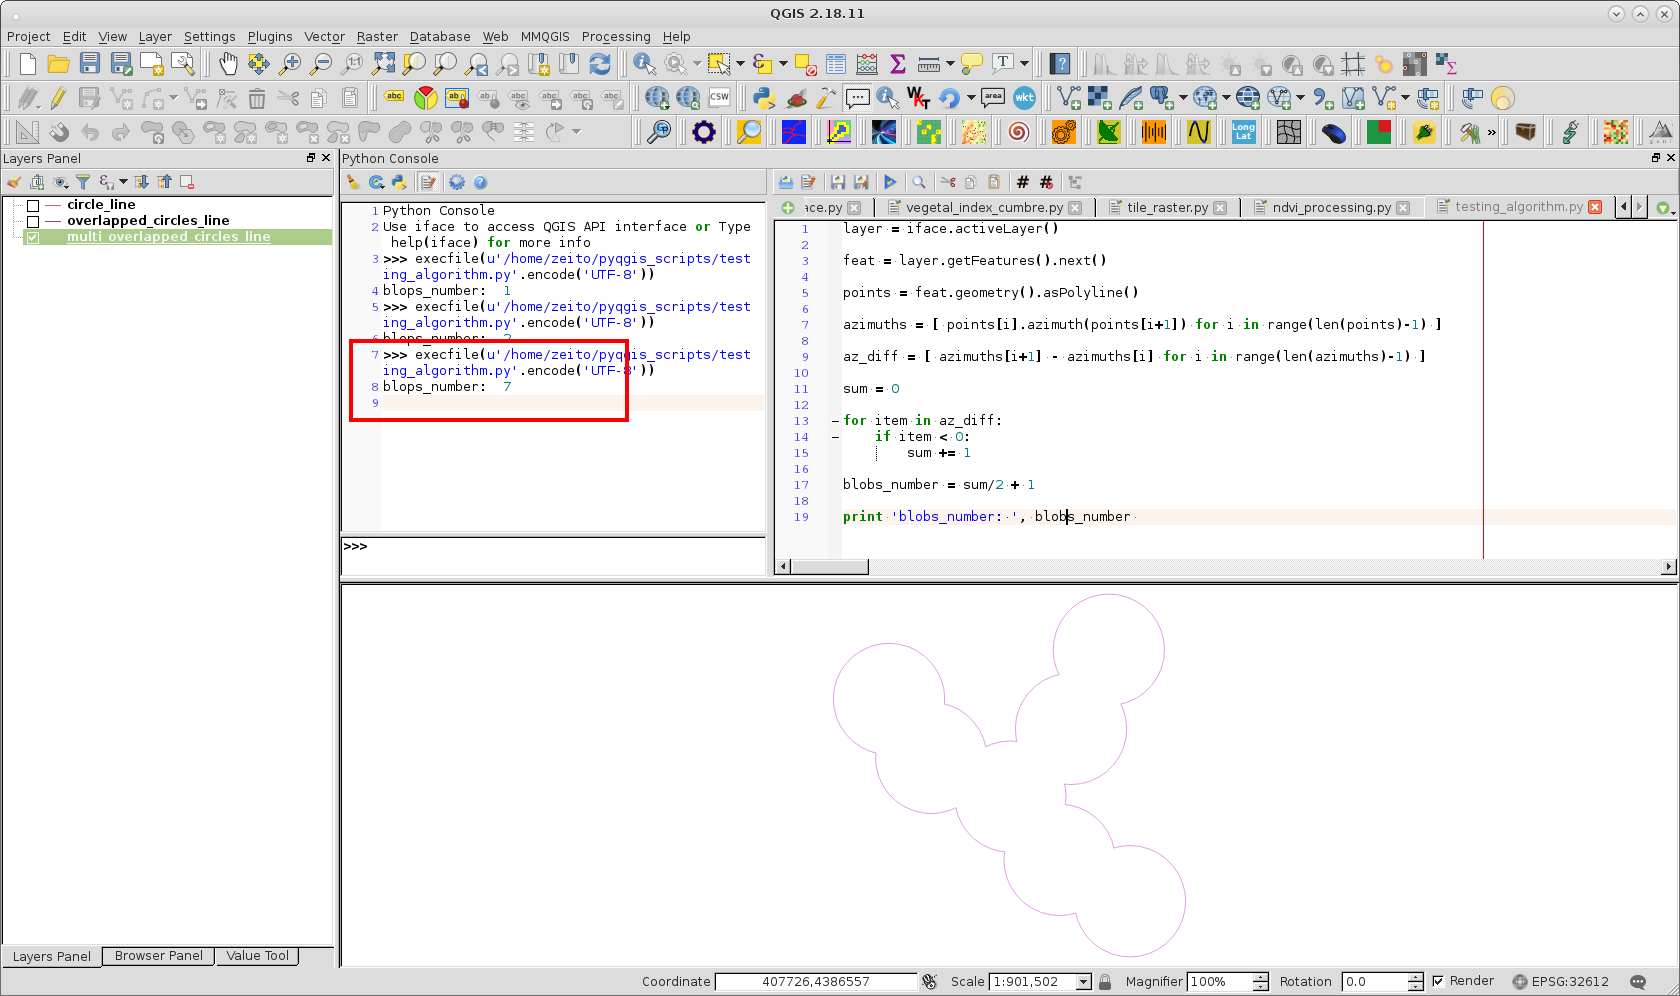
Now, with this image, I'd like to be able to identify the separate blobs, even if they're adjoined. In particular, I want to count individual blobs that are tightly overlapping. Like for instance: enter image description here For instance, in that image, I want to be able to count 7 separate blobs. However, edge detection only counts 1. If I use some solidity cutoff (area of blob/area of convex hull), I'm able to count 2.
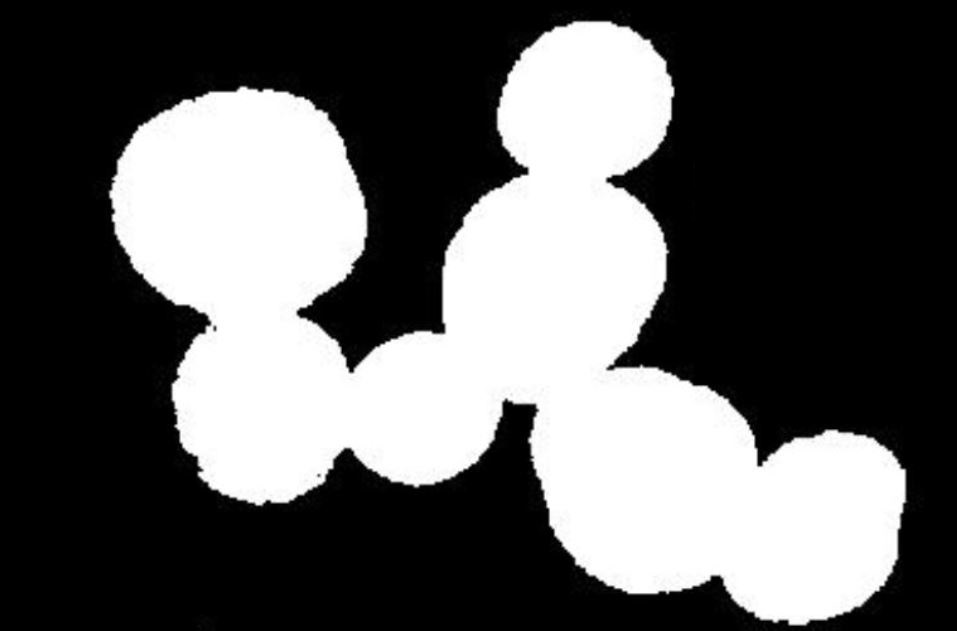
I'm not so concerned about the separate non-overlapping ones. But I'm having a really hard time detecting them using edge detection. I tried using Opencv's Canny function and HoughesCircles function. Neither of them proved effective.

Any idea how to proceed?

9
  • 1
    Have you been able to create the circles (from your image) that you wish to test for overlap yet? If not, then I think the Q&As that you have looked at are only relevant to your next step. I think your question here needs to start with "how to create circles from non-overlapping blobs?", then "how to create circles from overlapping blobs?"
    – PolyGeo
    Commented Oct 7, 2017 at 9:13
  • 1
    I'd think that a distance calculation with local maxima would get you 18-19 of the 20, but the tightly overlapped v. ellipse and edge case calculations would take some time to evaluate. The fact that this question encompasses both vector and raster and an NP-complete problem (computer vision) makes it extremely broad for our Focused Q&A format. If you can take out the raster to vector component, and the simple circles which are easily detected, and focus on the tightly overlapping figure problem in vector space, you'd likely get a better answer.
    – Vince
    Commented Oct 7, 2017 at 11:13
  • @PolyGeo I'm not sure I understand. Can you please elaborate? What I've understood is the following. You're asking if I can create those blobs? No, I cannot create those blobs. I receive those images as such.
    – Jonathan
    Commented Oct 7, 2017 at 19:21
  • Hello Vince, I understand the difference between vector(composed of lines,paths) and raster(composed of pixels), but I don't quite understand how you deduced that this image requires vector, raster, and an NP complete problem. I'm more of software engineering background. So, if you could explain further what you meant, for knowledge sake, that'd be very helpful. How would I take out the raster to vector component? And as you suggested, I'm only after how to detect the tightly overlapping figures. I've edited the question to reflect that.
    – Jonathan
    Commented Oct 7, 2017 at 19:26
  • @Vince I can read the image as a matrix as it is originally in tif format. Then, I can convert that matrix to a vector in matlab, if that helps. I'm just not sure how to proceed from there.
    – Jonathan
    Commented Oct 7, 2017 at 20:13

2 Answers 2

3

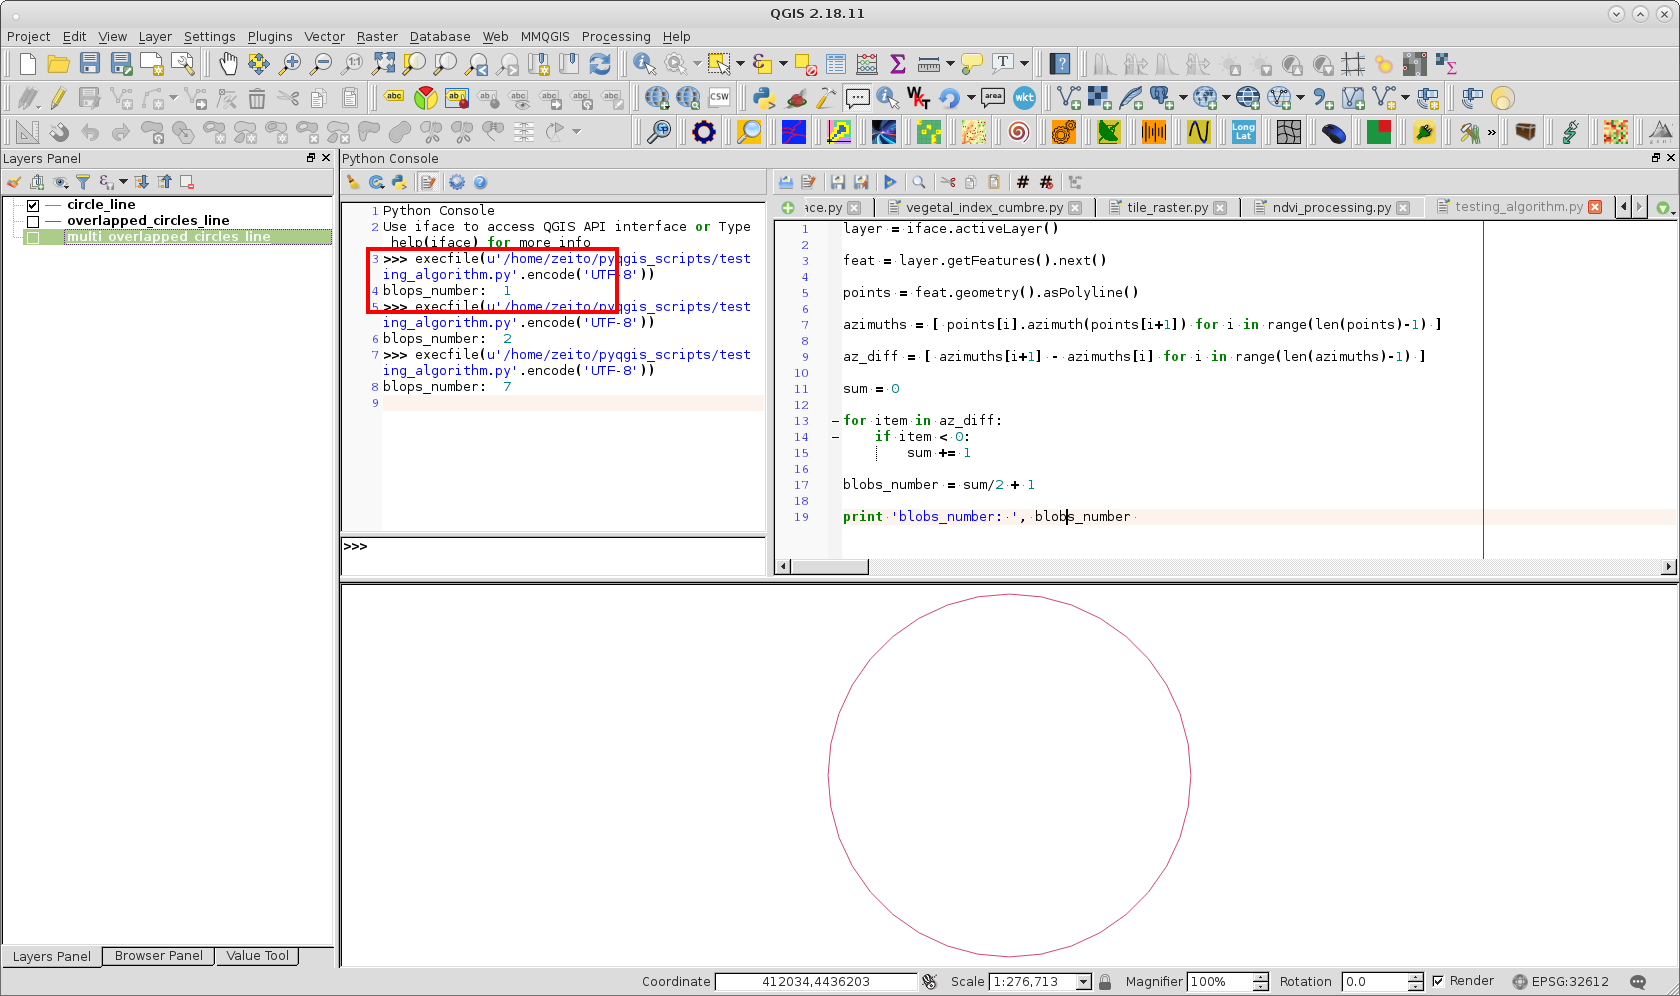
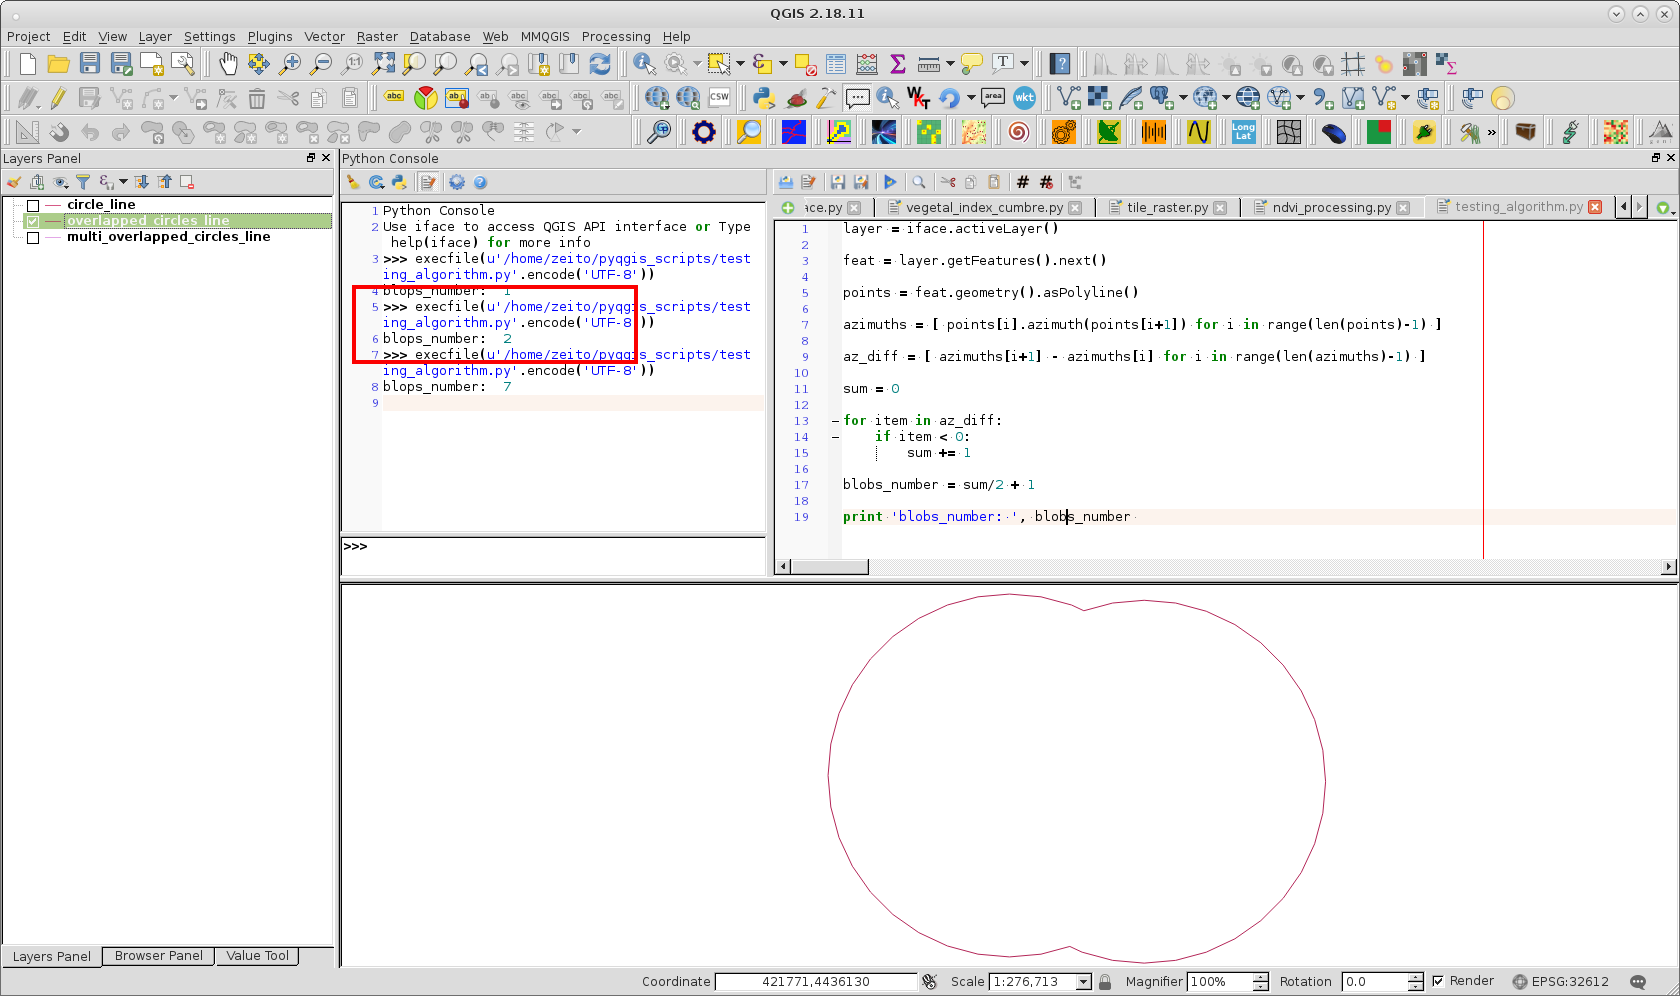
I tried out an algorithm based in azimuths and second derivatives, by using contours circulars, and it works well. PyQGIS code is as follows:

layer = iface.activeLayer()

feat = layer.getFeatures().next()

points = feat.geometry().asPolyline()

azimuths = [ points[i].azimuth(points[i+1]) for i in range(len(points)-1) ]

az_diff = [ azimuths[i+1] - azimuths[i] for i in range(len(azimuths)-1) ]

sum = 0

for item in az_diff:
    if item < 0:
        sum += 1

blobs_number = sum/2 + 1

print 'blobs_number: ', blobs_number 

For one circular "blob":

enter image description here

For two overlapped "blobs":

enter image description here

For seven overlapped "blobs":

enter image description here

Results were as expected.

2
  • Amazing solution. I'm still trying to test it and understand it. Is it possible to run this on just python/matlab?
    – Jonathan
    Commented Oct 8, 2017 at 6:18
  • Yes. You only need arrays of points. However, I used perfectly circular lines with points regularly spaced and it was relatively easy to have a condition for my if code. In your case, you probably will have "noise" in your data because blobs are not perfectly circular. So, you need to do an exploratory analysis for finding out the threshold corresponding to big changes in slope for your if code condition.
    – xunilk
    Commented Oct 8, 2017 at 12:35
2

I am aware you already found the solution, so this is just for future reader (if any) who might be interested in. (As this can also be seen as an image processing).

In bio and medical area, ImageJ is well-know for such a task. Not frequently, but there are some discussions in this forum with subjects related to remote sensing.

Using ImageJ workflow would be;

  1. Download and install ImageJ.
  2. Load your image file (drag and drop the image to ImageJ menu bar).
  3. Make it binary (0,1) image Process | Binary | Make Binary
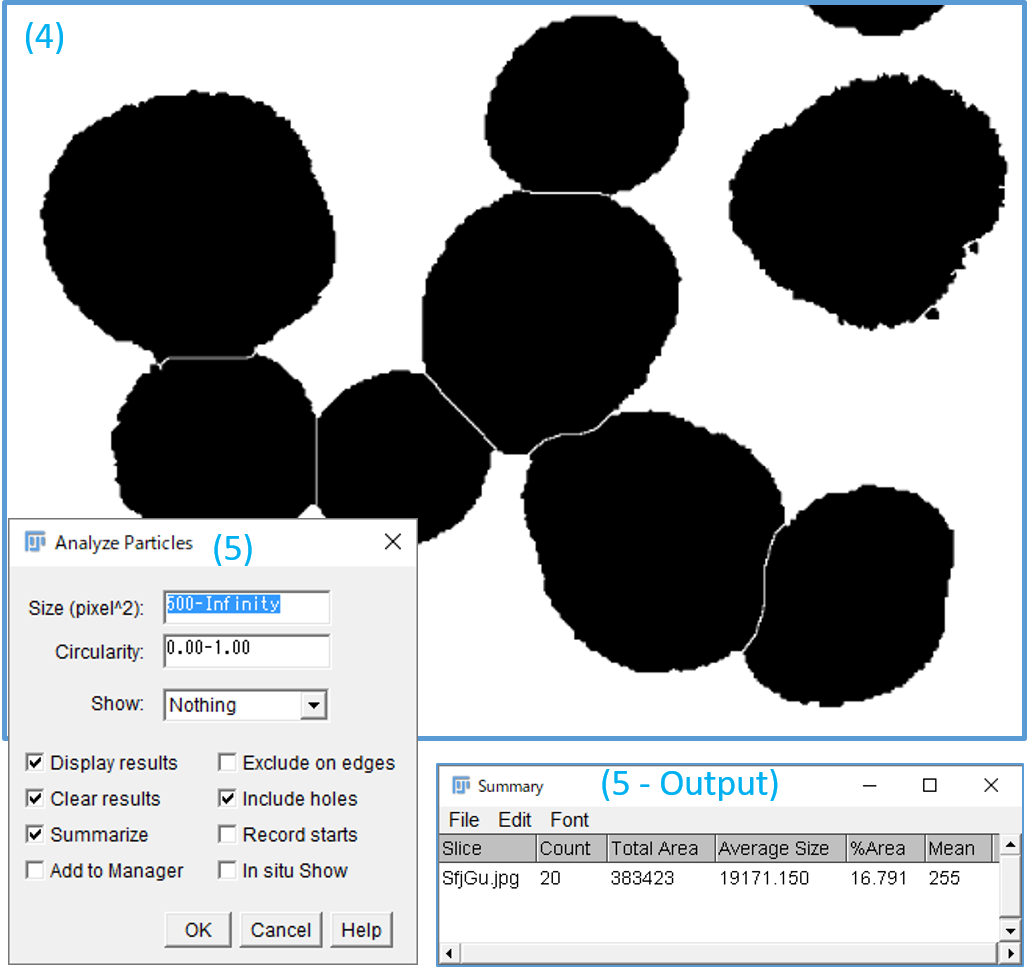
  4. Break-apart (isolate) fused particles. Process | Binary | Watershed.
  5. Count particles by Analyze | Analyze Particles.(minimum size~ 500 pixels)
  6. AS the process (3) flips black/white, you may want to reverse the B/W back to original by Edit | Invert.

enter image description here

1
  • @Jonathan Thank you. Sorry I could not add images yesterday for some reason. With this image I just wanted to show you (4) how Watershed works, (5) where to put minimum 500 pixel size, and (6) the output (it counted 20 particles).
    – Kazuhito
    Commented Oct 10, 2017 at 9:28

Your Answer

By clicking “Post Your Answer”, you agree to our terms of service and acknowledge you have read our privacy policy.

Not the answer you're looking for? Browse other questions tagged or ask your own question.