2

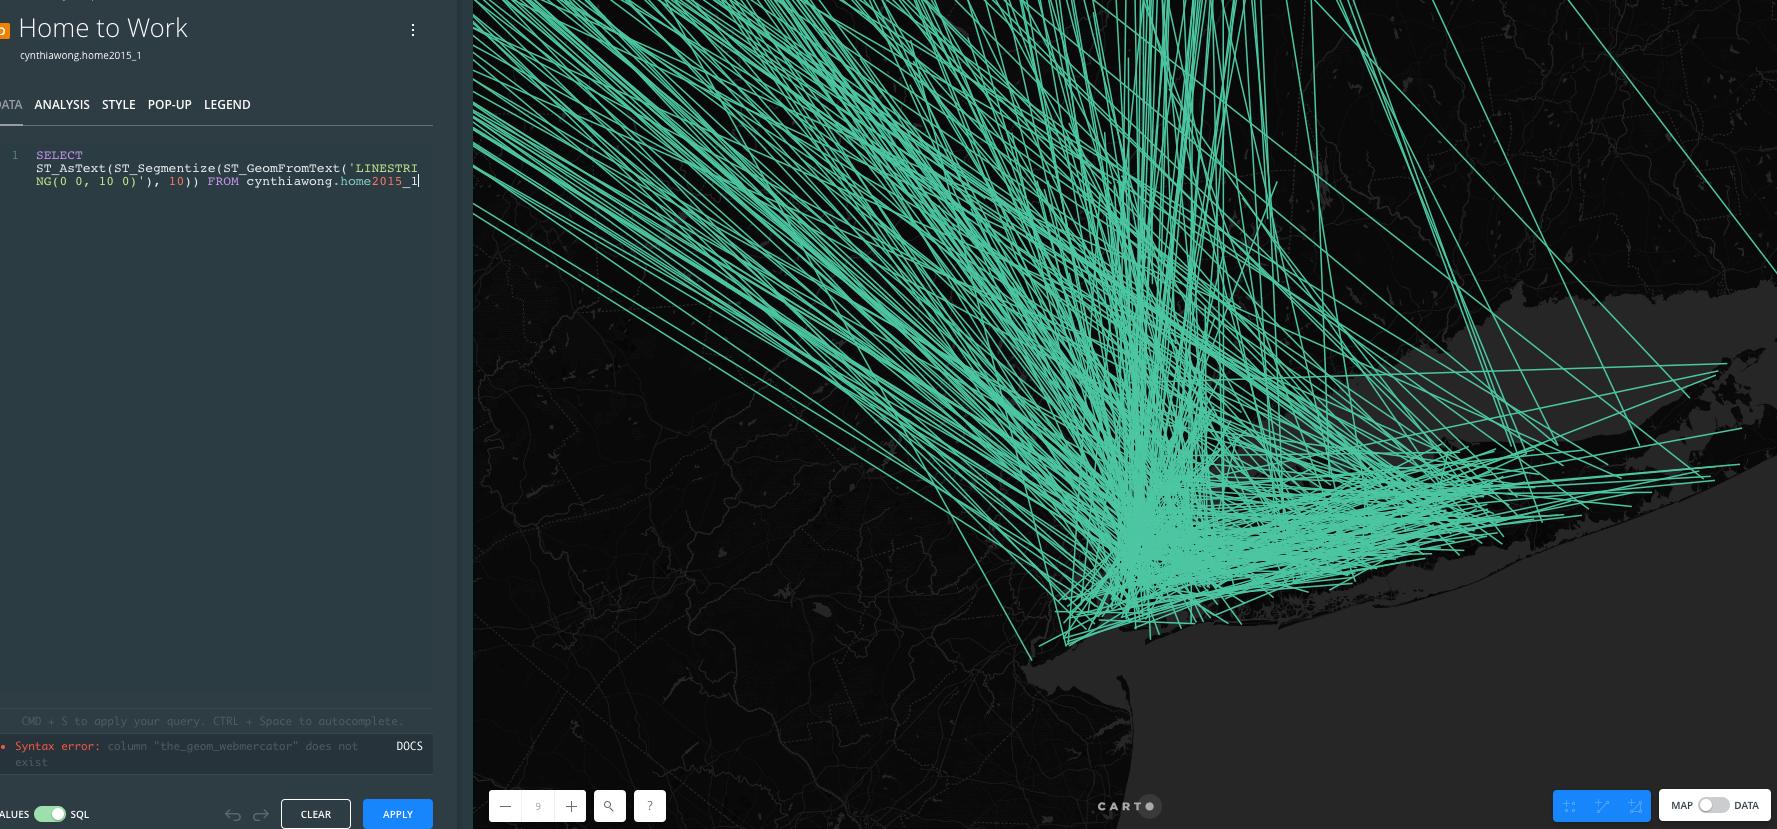
I need help with the phrasing of this query. I am applying this in CARTO to a file with lines. The following query does not generate a curve as expected. I am new to SQL/PostGIS.

select
  mycartoid.home2015_1, the_geom
  st_transform(
    st_segmentize(
      st_makeline(origin.h_block, dests.w_block )::geography,
      10000
     )::geometry,
    3857) the_geom_webmercator
  from origin,dests

my map enter image description here

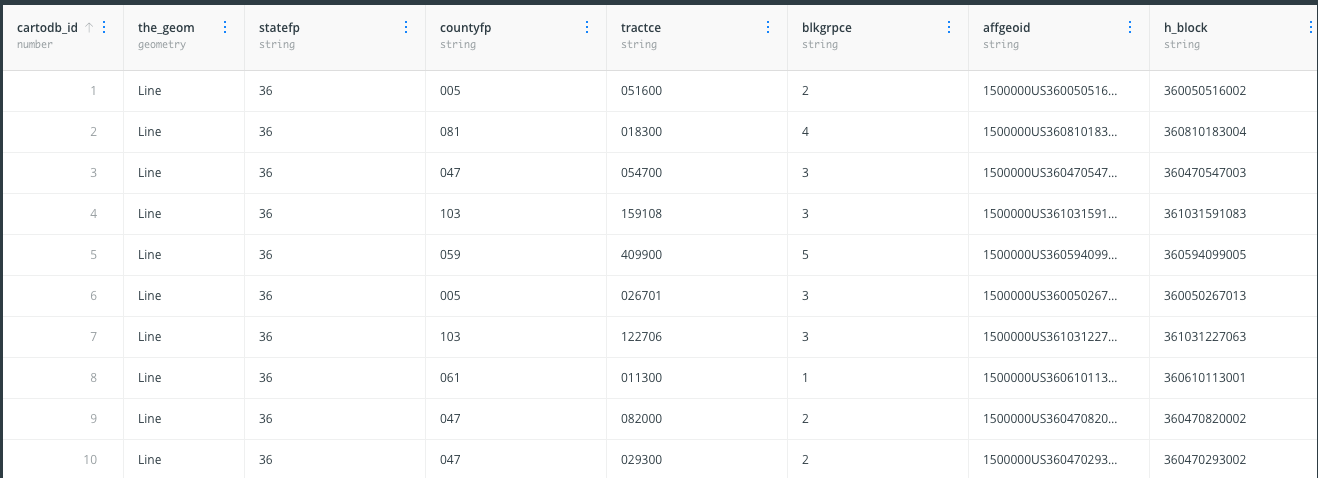
Also attached is a snippet of my data for reference:

data

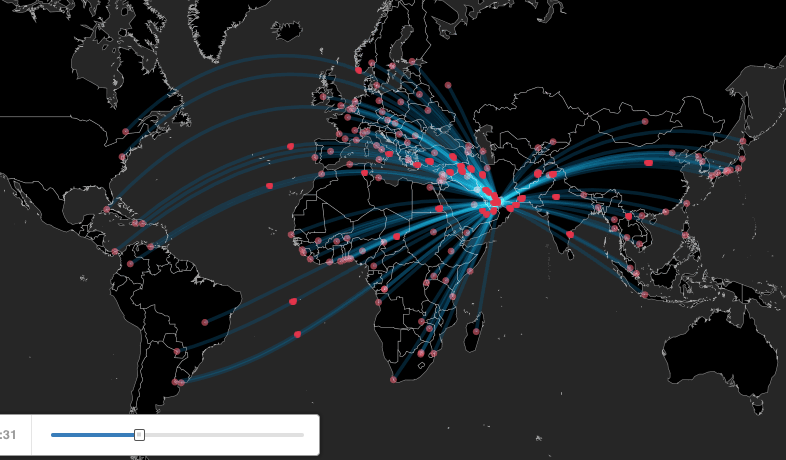
I am trying to generate a map with curved lines similar to this link:

https://team.carto.com/u/jsanz/viz/89f6adfe-48f8-11e5-b416-0e0c41326911/public_map

SQL Query Link line 26-35 from this gist:

lines as(
  select
  dests.cartodb_id,  dests.name, dests.adm0name, dests.distance,
  st_transform(
    st_segmentize(
      st_makeline(origin.the_geom, dests.the_geom )::geography,
      10000
     )::geometry,
    3857) the_geom_webmercator
  from origin,dests

segments

2
  • do you have origin & dest tables defined as points? that h_block column seems to be only text? if you are simply selecting from that one line table, try ... ST_MakeLine( ST_StartPoint(the_geom), ST_EndPoint(the_geom) ) ... FROM <your_line_layer> and see if that gets you your geographic linework.
    – geozelot
    Commented Sep 25, 2018 at 17:16
  • 1
    your first screenshot is a small area (Long Island?), are the lines still straight if you zoom out? i'd expect them to be straight at that scale. (not tried your query but it looks like it should work)
    – Steven Kay
    Commented Sep 25, 2018 at 17:43

1 Answer 1

1

looking at this again, I think you've got it working :-)

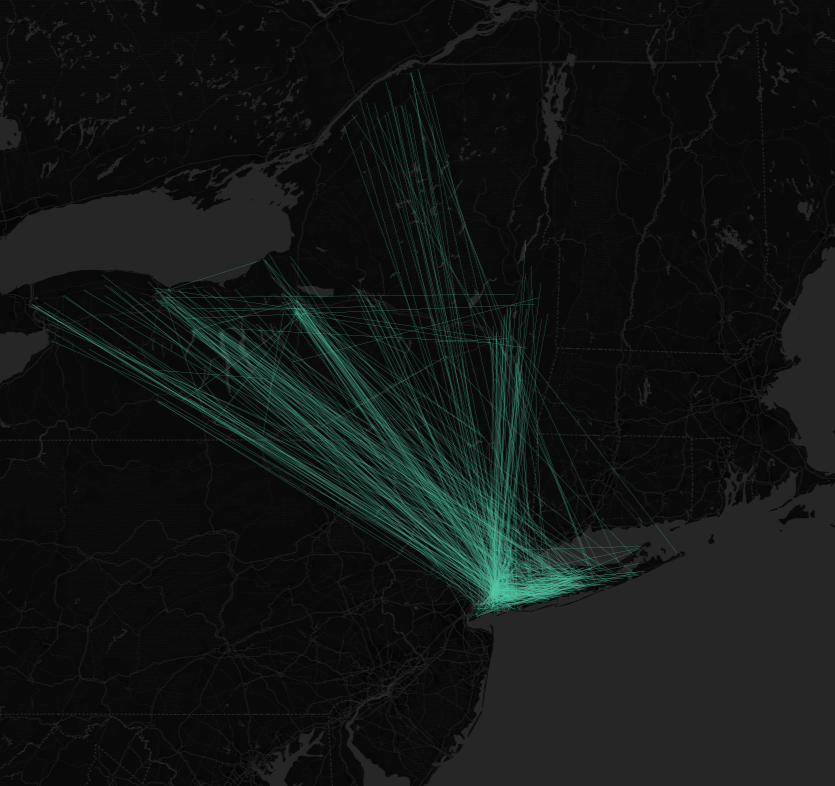
some of the long-haul routes are showing up as curved, although it's difficult to see - there are a lot of short-haul routes in there.

Reducing line opacity can sometimes help with this sort of visualisation (or making shorter routes more transparent)

When zoomed far in, great circles tend to look linear - you'll typically only see curvature over hundreds or thousands of Kilometers. If you zoom out, the curves should appear as you expected.

EDIT: I see you want to maximise the curviness of the lines at the scale you're showing.

For this you might need to digitise curves manually. See answers to this question, especially this one

Also, I see PostGIS can convert linestrings to curves e.g. ST_LineToCurve. I haven't tried this but it might be worth looking at.. if you change the control points you might be able to alter the curvature. (Not sure if CARTO supports curves, but you can always change the curves back to linestrings)

2
  • Hi! I have my line weights at .2. I am still having a hard time with seeing a curve. The area they are linked to is NYC. Is there a way to manipulate the query to show a more dramatic curve?
    – Cynthia W
    Commented Sep 25, 2018 at 20:31
  • 1
    I don't know the visualization tool you are using, but the Postgis sql request you use create lines (with multiple segments maybe), not curves. It is probable that the visualization tool you use convert lines in curve in big distances, to reproduce a realist line along the globe (srid 4326, 3D) in a planar map (srid 3857, 2D). As Steven says, if you really want curves, in a small region, make it directly in Postgis specific type curve. Commented Sep 26, 2018 at 8:41

Your Answer

By clicking “Post Your Answer”, you agree to our terms of service and acknowledge you have read our privacy policy.

Not the answer you're looking for? Browse other questions tagged or ask your own question.