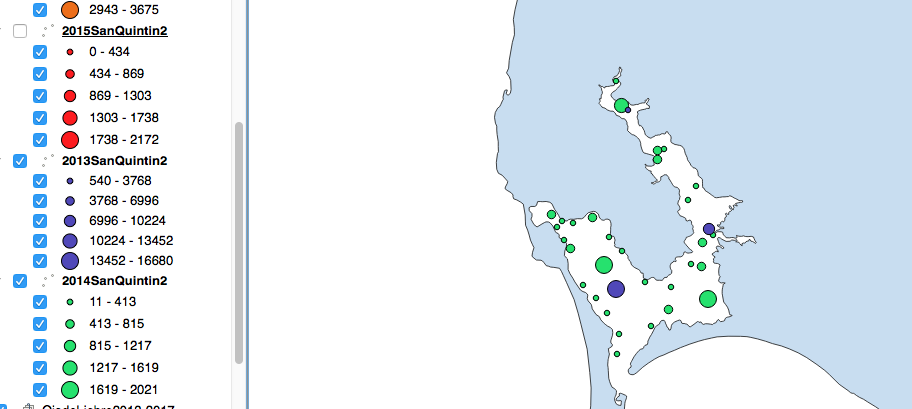
I am mapping population abundance and distribution of a bird species in a one area. I am using several years worth of data to show how population and distribution vary by year. The years are marked differently by color. How do I make the year's population radius proportional to the year with the highest population? I need to do this so that the radii of the points are normalized. 
Add a comment
|
1 Answer
Copy the style from the year with the highest maximum population to all the others. Right click on the layer in the Layer Panel > styles > copy style.
