Let's make a reproducible example...
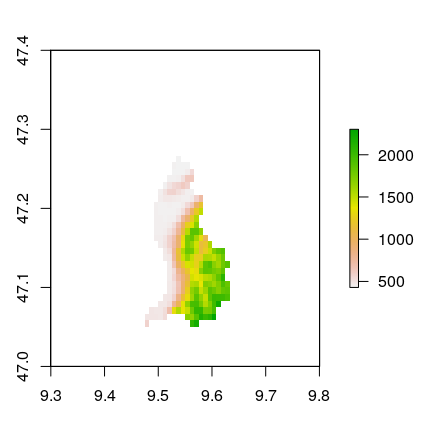
First use the raster::getData package to get a raster of the heights of Liechtenstein (because Liechtenstein is quite small so we can see what its doing, and also because I played in a band that had a number 3 hit in the country...):
> library(raster)
> library(sp)
> raster1 = getData('alt', country='LIE', mask=TRUE)
> plot(raster1)

That's a raster like yours. Let's convert to vector format as a Spatial Data Frame. Each pixel becomes a rectangle and the altitude is stored in the LIE_msk_alt column:
> polys1 = rasterToPolygons(raster1)
> names(polys1)
[1] "LIE_msk_alt"
Now we can plot that using spplot with the same colour scheme as the raster plotting function:
> cols = rev(terrain.colors(255))
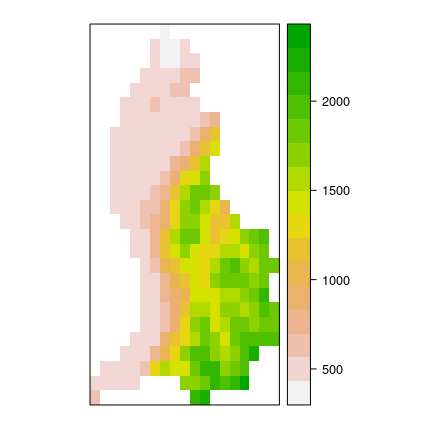
> spplot(polys1, "LIE_msk_alt", col.regions=cols, lwd=0)

which is near enough to the raster plot.
If you want to save this as a shapefile, then use raster::shapefile:
> raster::shapefile(polys1, "polys1.shp")
BUT note that shapefiles DO NOT save the style (the colour palette etc), only the data.


