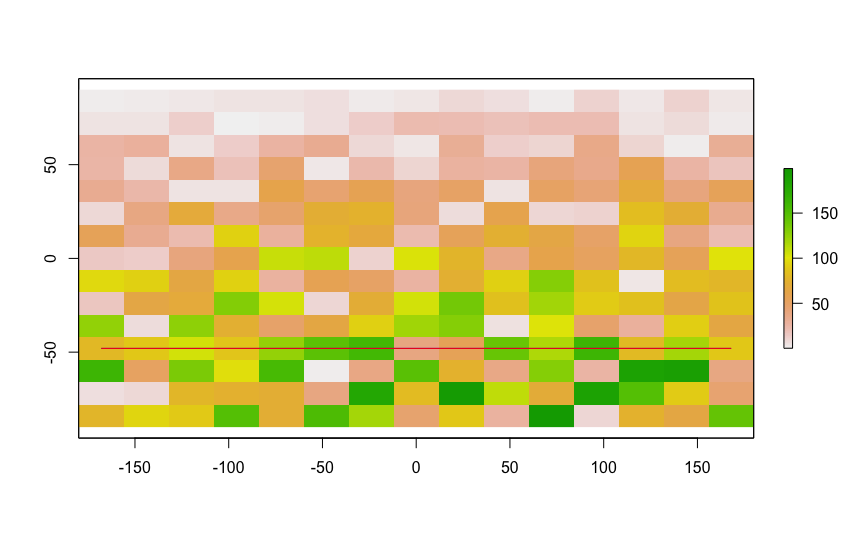
Make a sample raster:
> r = raster()
> r[] = 10 * (1:ncell(r))
Note the value of the cell is going to be 10 times the cell number...
Which row is latitude -20?
> row = rowFromY(r, -20)
> row
[1] 111
Row 111. Ok. What are the cell numbers for row 111?
> cells = cellFromRow(r, row)
> cells[1:10]
 [1] 39601 39602 39603 39604 39605 39606 39607 39608 39609 39610
and what are the values in those cells?
> r[cells[1:10]]
 [1] 396010 396020 396030 396040 396050 396060 396070 396080 396090 396100
Ten times the cell number. You can check this is true for all the cells, not just the first ten as above. Ok we got all the rows and columns and commas in the right place.
Now where's those cells?
> xy = xyFromCell(r,cells)
> xy[1:10,]
           x     y
 [1,] -179.5 -20.5
 [2,] -178.5 -20.5
 [3,] -177.5 -20.5
 [4,] -176.5 -20.5
 [5,] -175.5 -20.5
 [6,] -174.5 -20.5
 [7,] -173.5 -20.5
 [8,] -172.5 -20.5
 [9,] -171.5 -20.5
[10,] -170.5 -20.5
Constant y value, great, variable x value, super.
Put it all together:
> output = data.frame(xy, r[cells])
> head(output)
       x     y r.cells.
1 -179.5 -20.5   396010
2 -178.5 -20.5   396020
3 -177.5 -20.5   396030
4 -176.5 -20.5   396040
5 -175.5 -20.5   396050
6 -174.5 -20.5   396060

