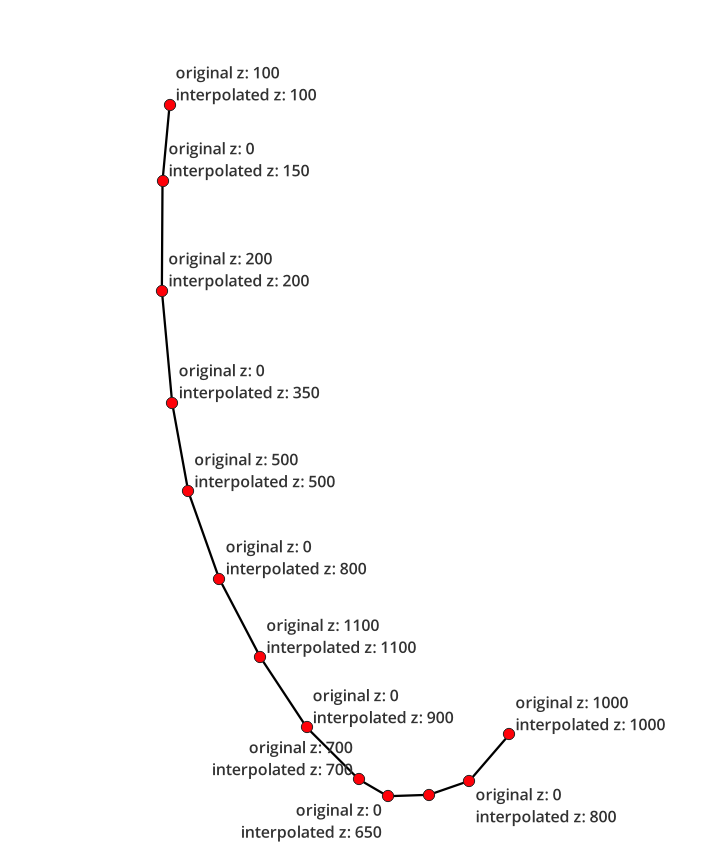
Z-values can be added to the vertices of lines by an operation called drape. This is normally done from a raster. Thus we have to get a raster, containing the interpolated z-values. What is a bit tricky: You can't have NULL values for z, they are automatically set to 0. So if you have vertex1 with z=100, vertex2 z=0 and vertex3 z=200, you probably want z for vertex 2 to be 150. So we first have to replace values of 0 with the mean of the value before and after this vertex.
The whole workflow looks as this:
Extract the vertices from you line using Menu Vector / Geomtry Tools / Extract vertices.
On the extracted vertices, create a new field called z using Field calculator. Use the following expression - it checks if the z-value is 0 and in this case, it interpolates the z-value between the last and the next point (creating the mean of the two z-values, see screenshot at the bottom):
 if (
     z($geometry) =0,
     (z(geometry (get_feature_by_id (@layer, $id-1)))+z(geometry (get_feature_by_id (@layer, $id+1))))/2,
     z($geometry)
 )
Create a buffer around your points with a size so that they do not overlap.
Rasterize the buffers and set the field z (calculated in step 2) as Field to use for a burn-in-value.
Use Menu Processing / Toolbox / Drape (set Z value from raster) with your initial line as input and the raster from step 4 as raster layer. This will add the values from the raster (that correspond to the interpolated z-values from step 2) as new z-values to your line.
You can now densify your line using Densify by inerval: thus adding additional vertices. z-values are then automatically interpolated.


