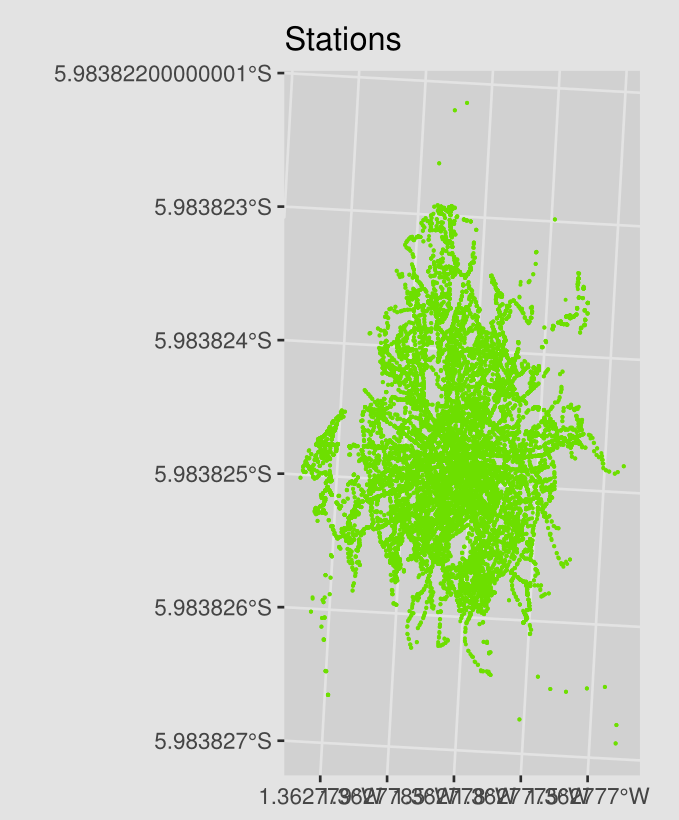
I drawing the plot of Île-de-France with
library(sf)
library(ggplot2)

df <- read.csv("https://raw.githubusercontent.com/leanhdung1994/Stat_Cons/main/station.csv")[1:3]
df2 <- st_as_sf(df, coords = c('V1','V2'), crs = 2154)

df3 <- ggplot() +
  geom_sf(data = df2,
          size = 0.1,
          color = "lawngreen",
          fill = "lawngreen") +
  ggtitle("Stations")

plot(df3)
My dataframe is
Simple feature collection with 25338 features and 1 field
geometry type:  POINT
dimension:      XY
bbox:           xmin: 48.66986 ymin: 2.012258 xmax: 49.05865 ymax: 2.782492
projected CRS:  RGF93 / Lambert-93
First 10 features:
    X                  geometry
1   1 POINT (48.85153 2.637754)
2   2 POINT (48.83918 2.638771)
3   3 POINT (48.85163 2.621466)
4   4  POINT (48.9135 2.482264)
5   5 POINT (48.99439 2.523624)
6   6 POINT (48.88744 2.325725)
7   7 POINT (48.85602 2.624391)
8   8  POINT (48.8531 2.281198)
9   9 POINT (49.00259 2.535003)
10 10 POINT (48.84394 2.627361)
My plot is
Could you explain why the coordinate from the plot is somewhere 5.98°S 1.7°W? I expect it would be somewhat 48.85°N 2.63°E.

