2

I'm using the protected area shape files from Protected Planet for Swaziland/ Eswatini.

I calculate a home range (95% kernel density) and want to measure the overlap in area between this and the protected areas. When I do so the area of overlap is greater than the area of the home range which is not possible. I don't see where I'm going wrong.

Here's my code:

# load packages
library(tidyverse)
library(amt)
library(sf)
library(spex)

#' load in the protected areas
merged_Africa = read_sf("shape//eswatini//WDPA_Apr2020_SWZ-shapefile-polygons.shp")
st_crs(merged_Africa) <- 4326
st_crs(merged_Africa)
merged_Africa_tranform <- st_transform(merged_Africa, "ESRI:102022")

#' location data
x_ <- c(707692, 707589, 707998, 708407, 708916, 709415)
y_ <- c(-3030991,-3031423,-3031640,-3031750,-3032508,-3037158)
mydata <- data.frame(x_, y_)

# transform to trk
trk <-
  mk_track(mydata,
           .x = x_,
           .y = y_,
           crs = CRS("+proj=aea +lat_1=20 +lat_2=-23 +lat_0=0 +lon_0=25 +x_0=0 +y_0=0 +ellps=WGS84 +datum=WGS84 +units=m +no_defs"))

#' calculate home range area
kde_shape_1 <- trk %>%
  hr_kde(., levels = c(0.95))
hr_area(kde_shape_1) / 1e6 # 52.00846

#' convert raster to polygon
psf <- qm_rasterToPolygons(kde_shape_1$ud, na.rm = TRUE)

#' measure the intersection
intersection <-
  st_intersection(psf$geometry, merged_Africa_tranform$geometry)
sum(st_area(intersection)) / 1e6 # 61.21044

1 Answer 1

2

I'm not quite sure it is what you are looking for but let's give it a try. I run your code, plotting each step so I could analyze graphically the different outputs:

library(tidyverse)
library(amt)
library(sf)
library(spex)

#' load in the protected areas
mycrs <- "+proj=aea +lat_1=20 +lat_2=-23 +lat_0=0 +lon_0=25 +x_0=0 +y_0=0 +datum=WGS84 +units=m +no_defs "

merged_Africa = read_sf("pathToFile/WDPA_Jun2020_SWZ-shapefile-polygons.shp")
st_crs(merged_Africa) <- 4326
merged_Africa_tranform <- st_transform(merged_Africa, mycrs)
st_crs(merged_Africa_tranform)

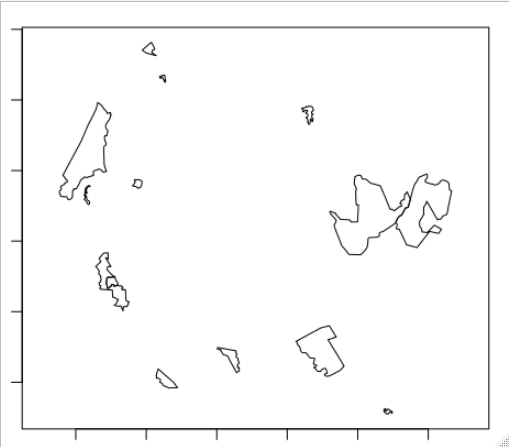
Plotting it I get:

Figure 1

The next steps on your code will throw the next result:

#' location data
x_ <- c(707692, 707589, 707998, 708407, 708916, 709415)
y_ <- c(-3030991,-3031423,-3031640,-3031750,-3032508,-3037158)
mydata <- data.frame(x_, y_)

# transform to trk
trk <-
  mk_track(mydata,
           .x = x_,
           .y = y_,
           crs = CRS("+proj=aea +lat_1=20 +lat_2=-23 +lat_0=0 +lon_0=25 +x_0=0 +y_0=0 +ellps=WGS84 +datum=WGS84 +units=m +no_defs"))

#' calculate home range area
kde_shape_1 <- trk %>%
  hr_kde(., levels = c(0.95))
hr_area(kde_shape_1) / 1e6 # 52.00846

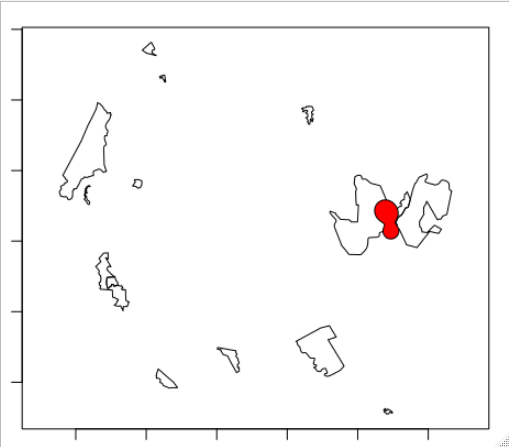
Figure 2

Which I believe is the home area you are defining. Then you do the following:

psf <- qm_rasterToPolygons(kde_shape_1$ud, na.rm = TRUE)

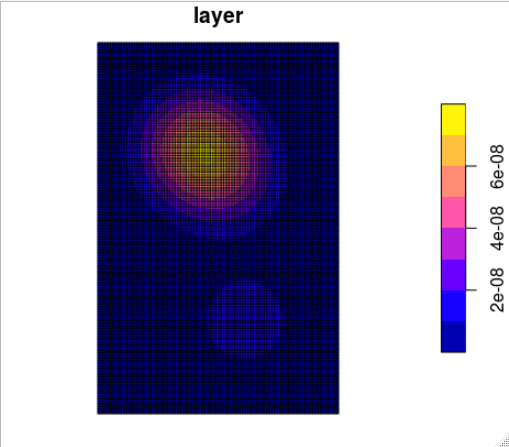
If we plot it, we get:

Figure 3

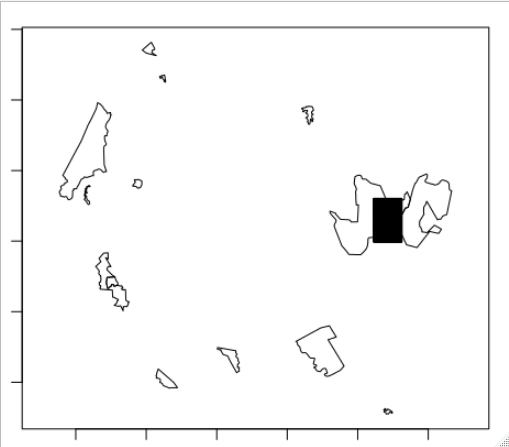
Which I'm guessing is not what you want and might be the origin of your problems. It seems that the function qm_rasterToPolygons uses the whole bounding box of the raster to create a grid of squared polygons (see next figure) rather than creating a polygon with the shape of the home area in figure 2.

Figure 4

If, instead, we use the function hr_isopleths as follows:

test <- hr_isopleths(kde_shape_1)

And we plot it, we obtain the same case as in figure 2 but with the area defined as a polygon with which we can work. Calculating the intersection again as:

intersection <-
  st_intersection(test$geometry, merged_Africa_tranform$geometry)
sum(st_area(intersection)) / 1e6

We now obtain an area of 34.68964 [m^2]

1
  • Thanks very much, that's exactly what I was after. I double checked it by reducing the level of the kernel to 0.1, this gives a smaller area of 1.437821 km2 which is contained fully within the protected area so the st_intersection line gives the same value for the area.
    – adkane
    Commented Jun 8, 2020 at 15:17

Your Answer

By clicking “Post Your Answer”, you agree to our terms of service and acknowledge you have read our privacy policy.

Not the answer you're looking for? Browse other questions tagged or ask your own question.