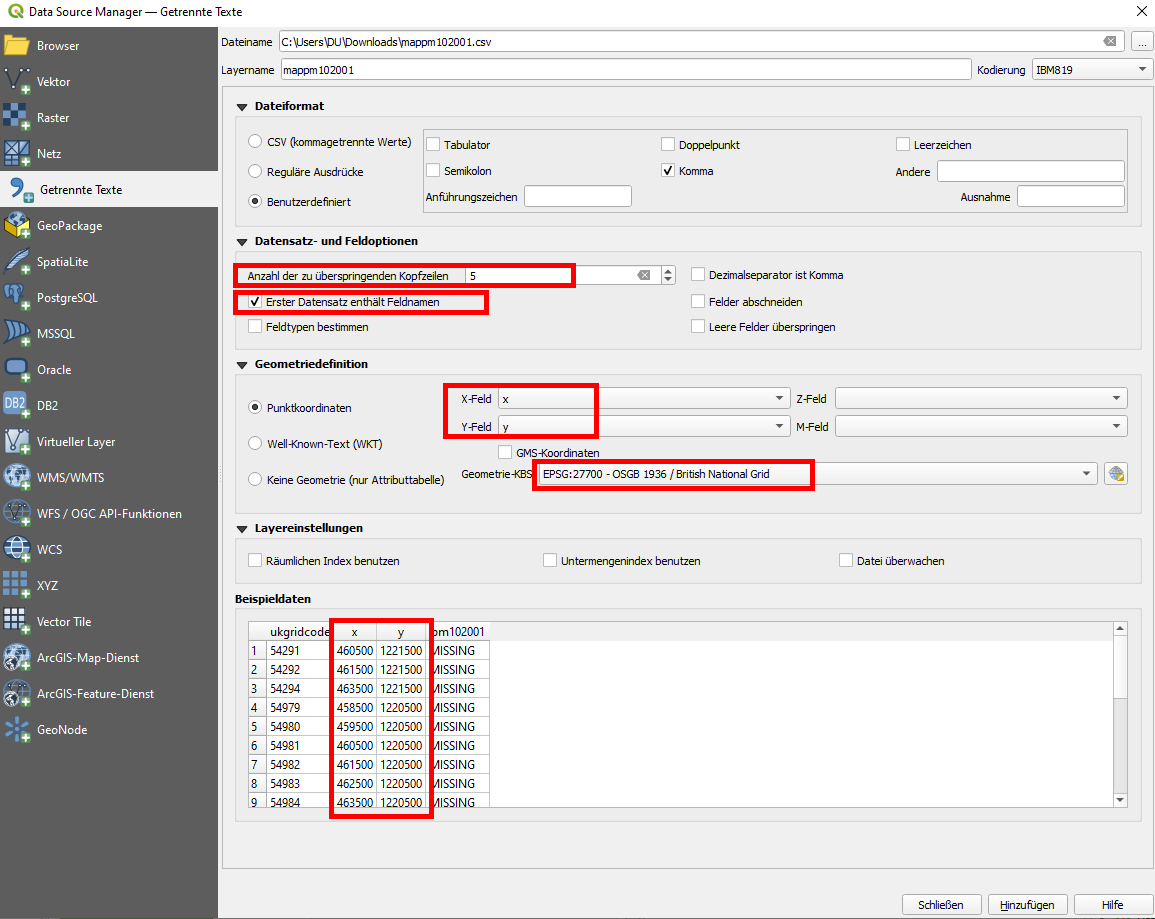
I am fairly new to spatial analysis and I am trying to create a map of the spatial distribution of pollution in the UK using publicly available data retrieved from https://uk-air.defra.gov.uk/data/pcm-data.
The files are all downloadable as .csv and provide the x and y coordinates for the centroid of each grid cell.
I tried to import them on QGIS 3.10 in the following way: Layer > Add Layer > Add Delimited Text Layer... Once I select the file, QGIS automatically recognizes the centroids as my x and y coordinates. However, when I try to plot them, my pollution concentrations do not overlap with UK geographical boundaries.
My ultimate goal is to join attributes from different datasets by location so I would need help understanding how to properly import my pollution csv files so that they overlap with my other shapefiles.

